VS Code
This section presents an overview of the different features provided by Popili in VS Code, and steps through how to use them effectively. We assume that you have Popili installed, and that you are able to create projects and Coco modules. If you need any help with this, then follow the step-by-step guide provided in Getting Started.
Overview
After installing Popili in VS Code, the layout and way of working is designed to follow that of VS Code as closely as possible. For example, you will find the debugging information for verification errors in VS Code’s existing debugger user interface. The high-level layout is as follows:
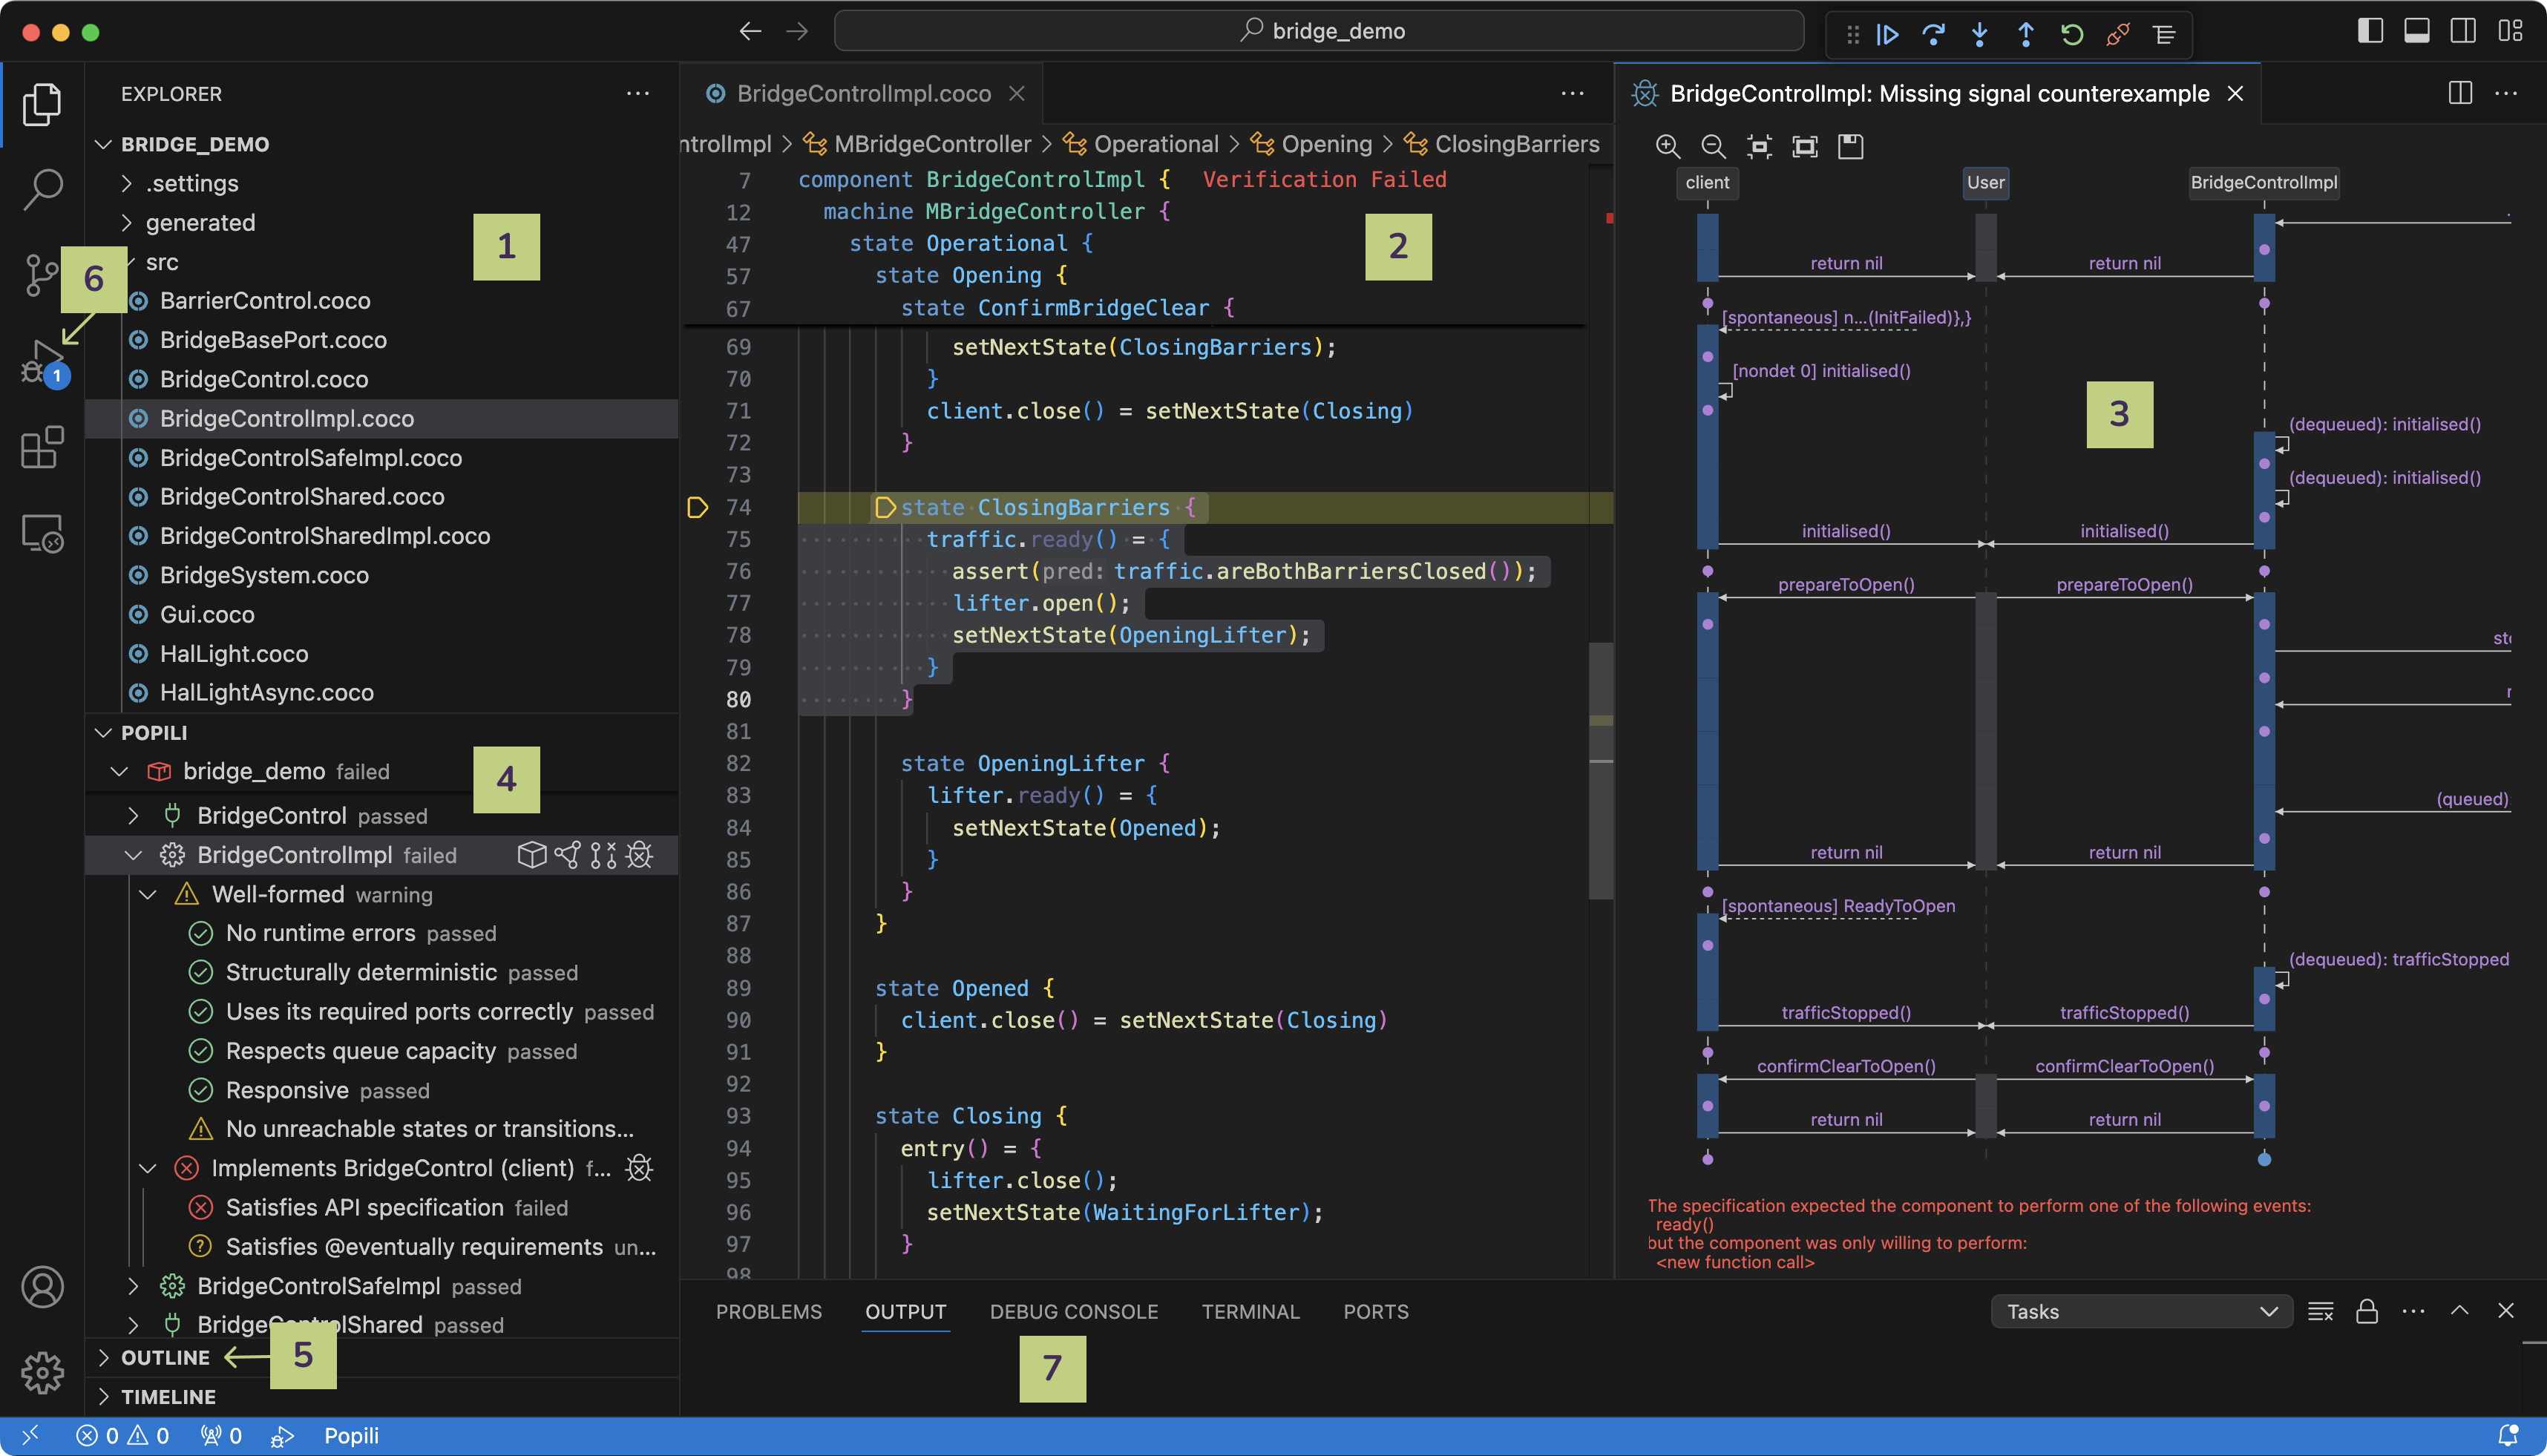
Each item highlighted in the figure above has the following functionality:
- The VS Code Explorer is where Coco projects, modules, and the generated code files are created, opened, closed, renamed, and deleted.
- The Coco Editor is where Coco modules are edited in the VS Code editor.
- The following Popili views will appear as tabbed headers in this panel:
- Counterexamples view displays extensive debugging information for the verification errors and warnings found by Popili.
- Simulator view is where you can drive the Popili simulator to interactively explore port and component state machines, and counterexamples.
- Verification Statistics view displays a summary of the verification details for all the ports and components in a given Coco project, such as verification status, duration, and number of transitions.
- Architecture Diagrams display graphical representations of the architectures of encapsulating components.
- State Machine Diagrams display graphical representations of port and component state machines.
- The Assertions view under POPILI displays the list of assertions to be verified, and their verification status.
- The Outline view displays the structure of the Coco module displayed in the currently selected editor view.
- The Run and Debug view displays additional debugging information, such as stack traces, variable assignments, and queue contents in the different states in a verification counterexample or simulation sequence.
- The Problems panel displays the usual additional information, such as warnings in your Coco files.
The layout can be reorganised in the usual way in VS Code, for example, by dragging and dropping the tabbed headers.
Many of Popili’s features summarised below can be run via VS Code’s Command Palette, which can be opened using the keyboard shortcut Ctrl+Shift+P on Linux and Windows, and Cmd+Shift+P on MacOS. If you start typing Popili, you will see the list of options appear.
Popili Preferences
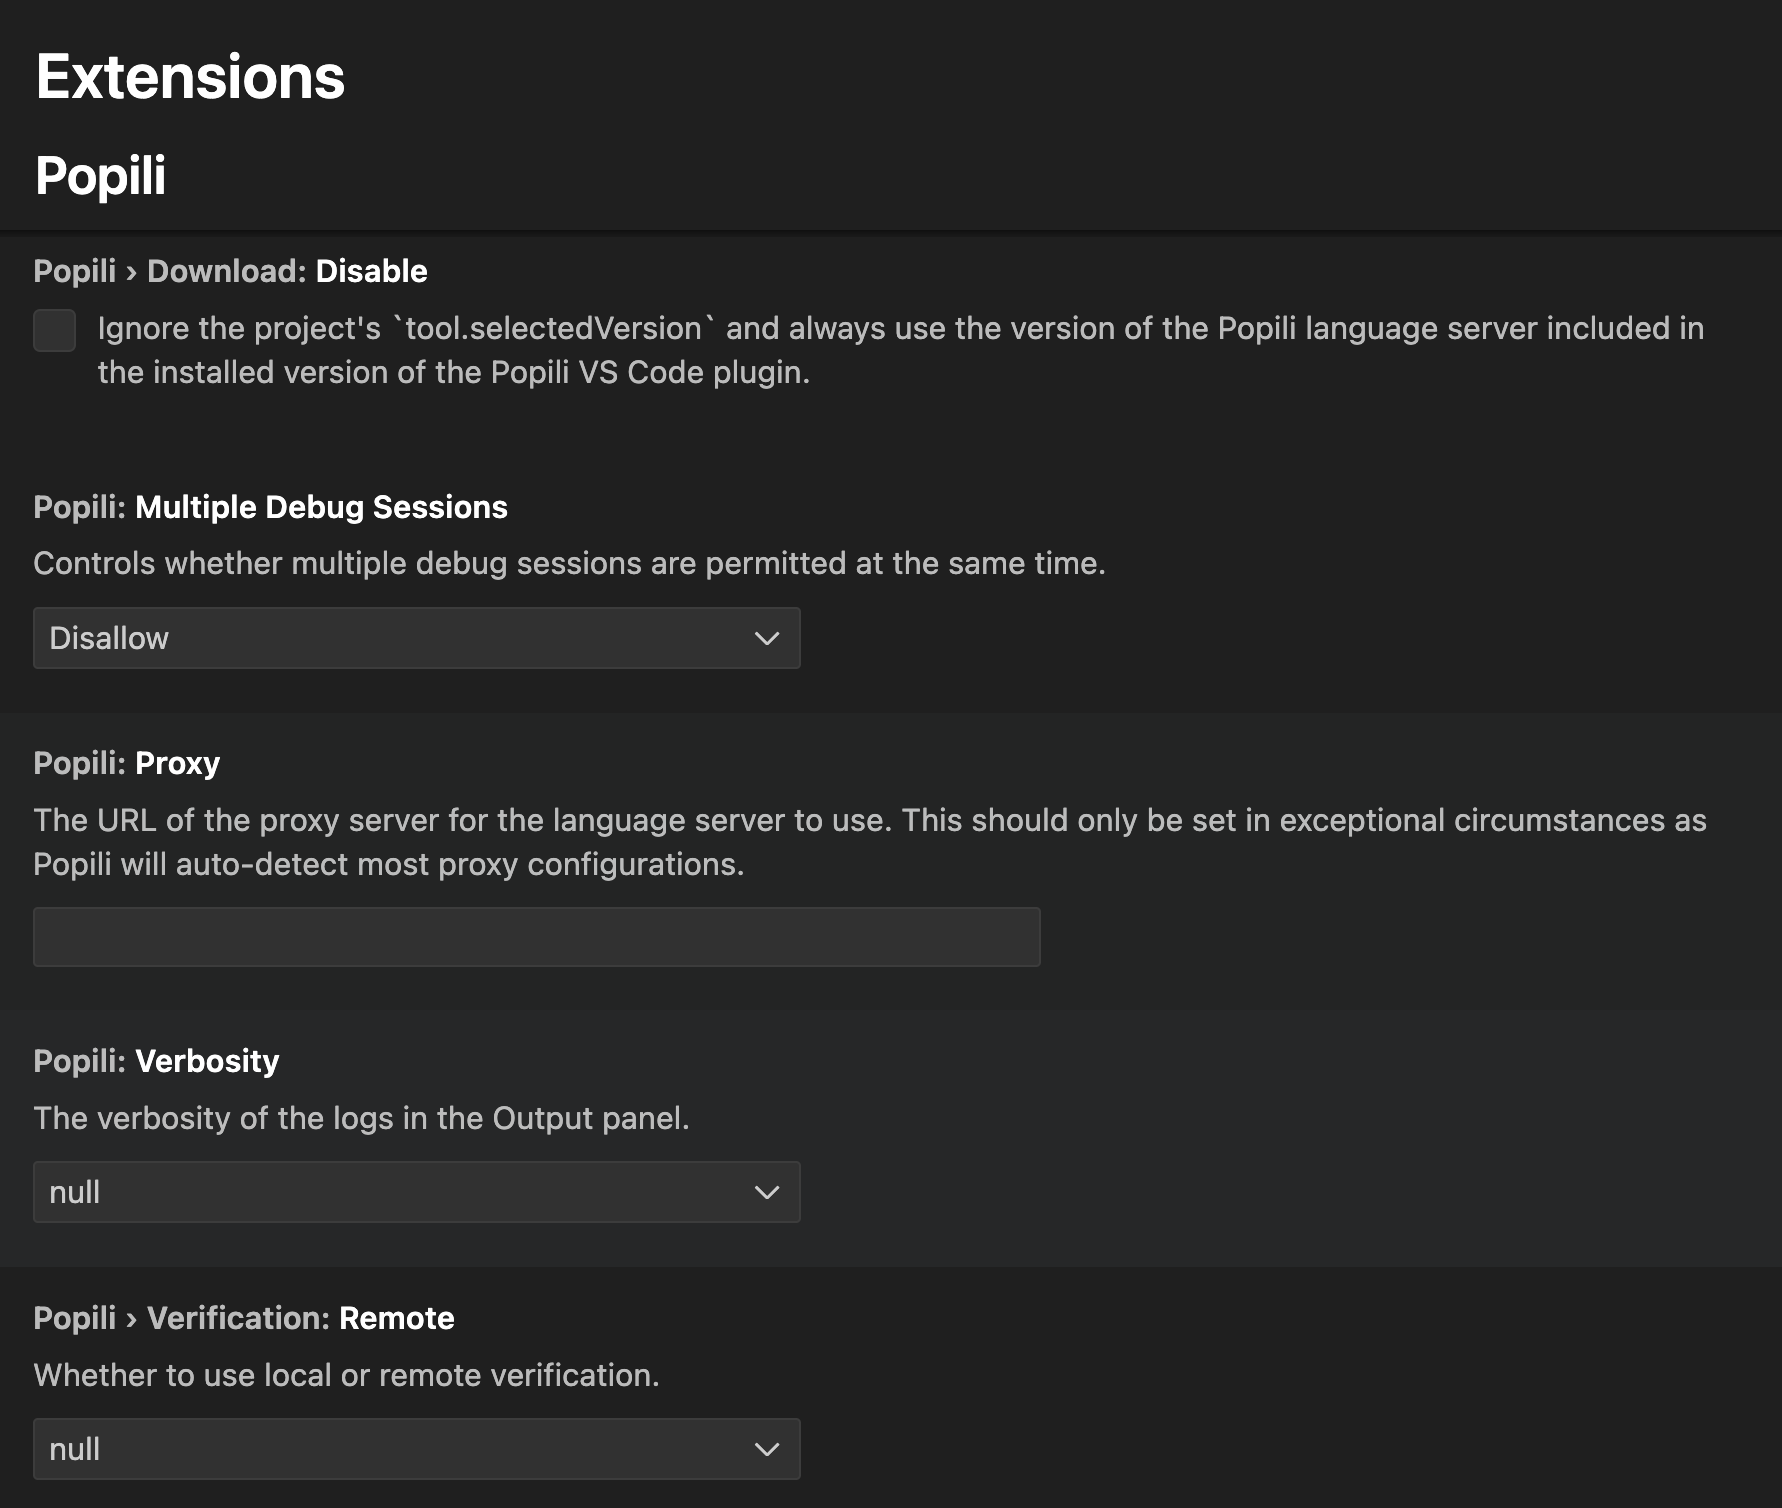
There are a number of Popili-specific preferences, which can be found in the VS Code settings:

In the VS Code settings, either search for Popili or select Popili in the extensions dropdown list:
The following list of preferences are displayed, together with a brief description for each of them:
Coco Packages
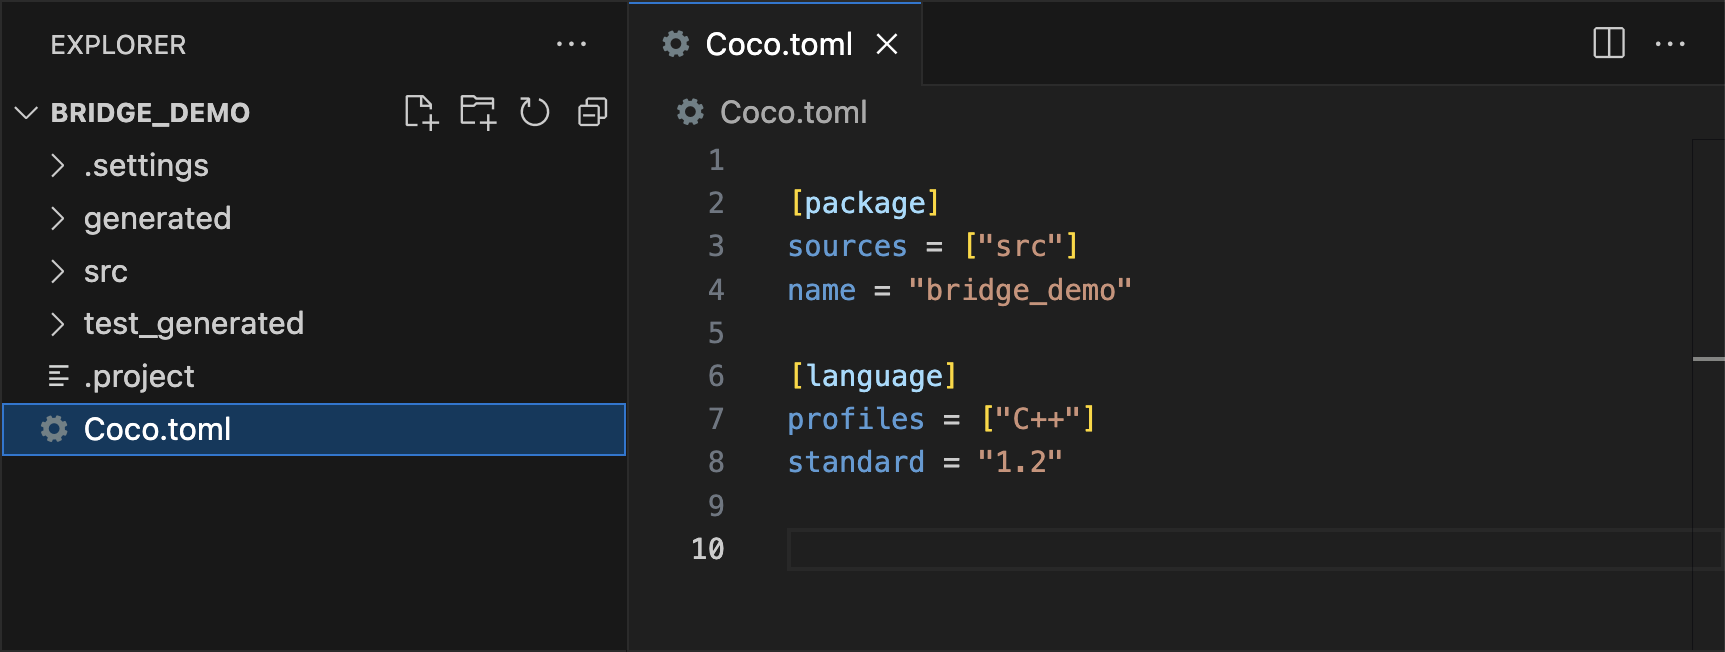
To use the Popili plugin for VS Code, simply open a folder containing a Coco package (i.e. a
folder containing a file called Coco.toml). When you create a new Coco project in VS
Code, a Coco.toml file is automatically created at the top level of your project directory containing the package
name, location of the Coco source files, and the Coco language version. This is illustrated in the following example of
a newly created Coco project called bridge_demo:
You can extend the Coco.toml file with additional configuration settings as described in the Packages and Workspaces
section.
See also
Coco Editor
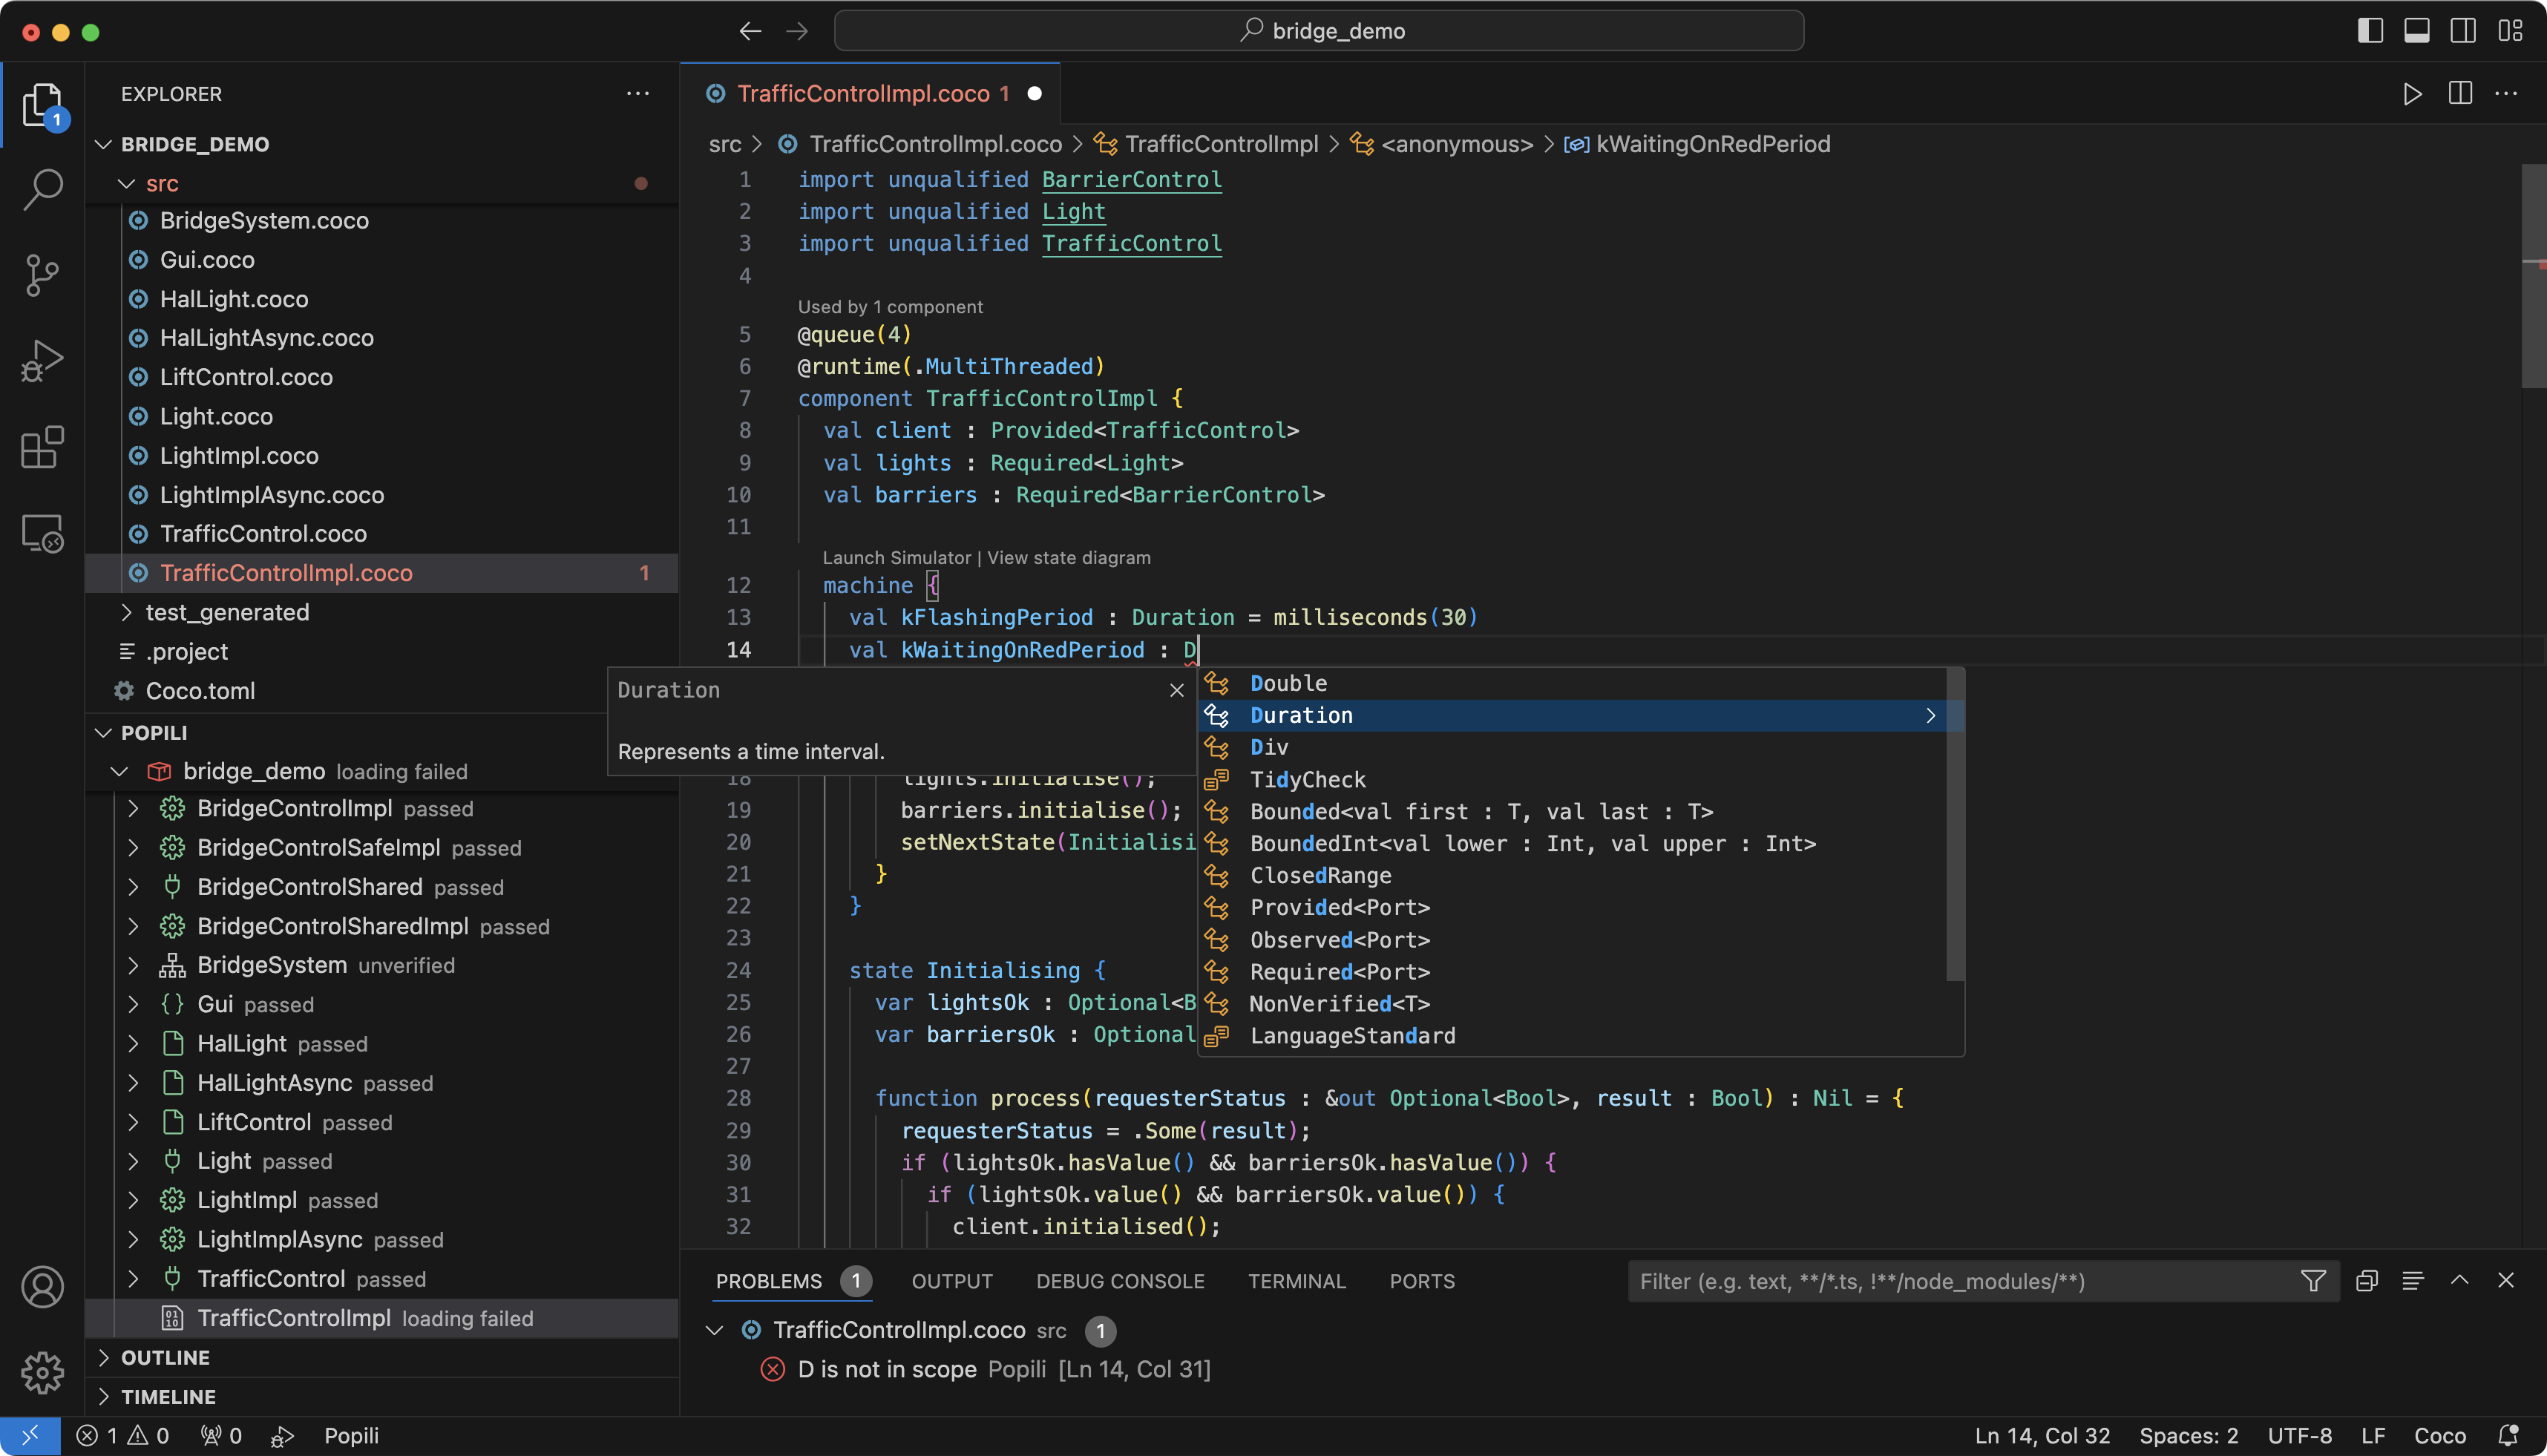
Popili integrates with VSCode’s editor to provide rich editing features when editing Coco files. The first of these is semantically-aware code completion. This runs automatically as you type.
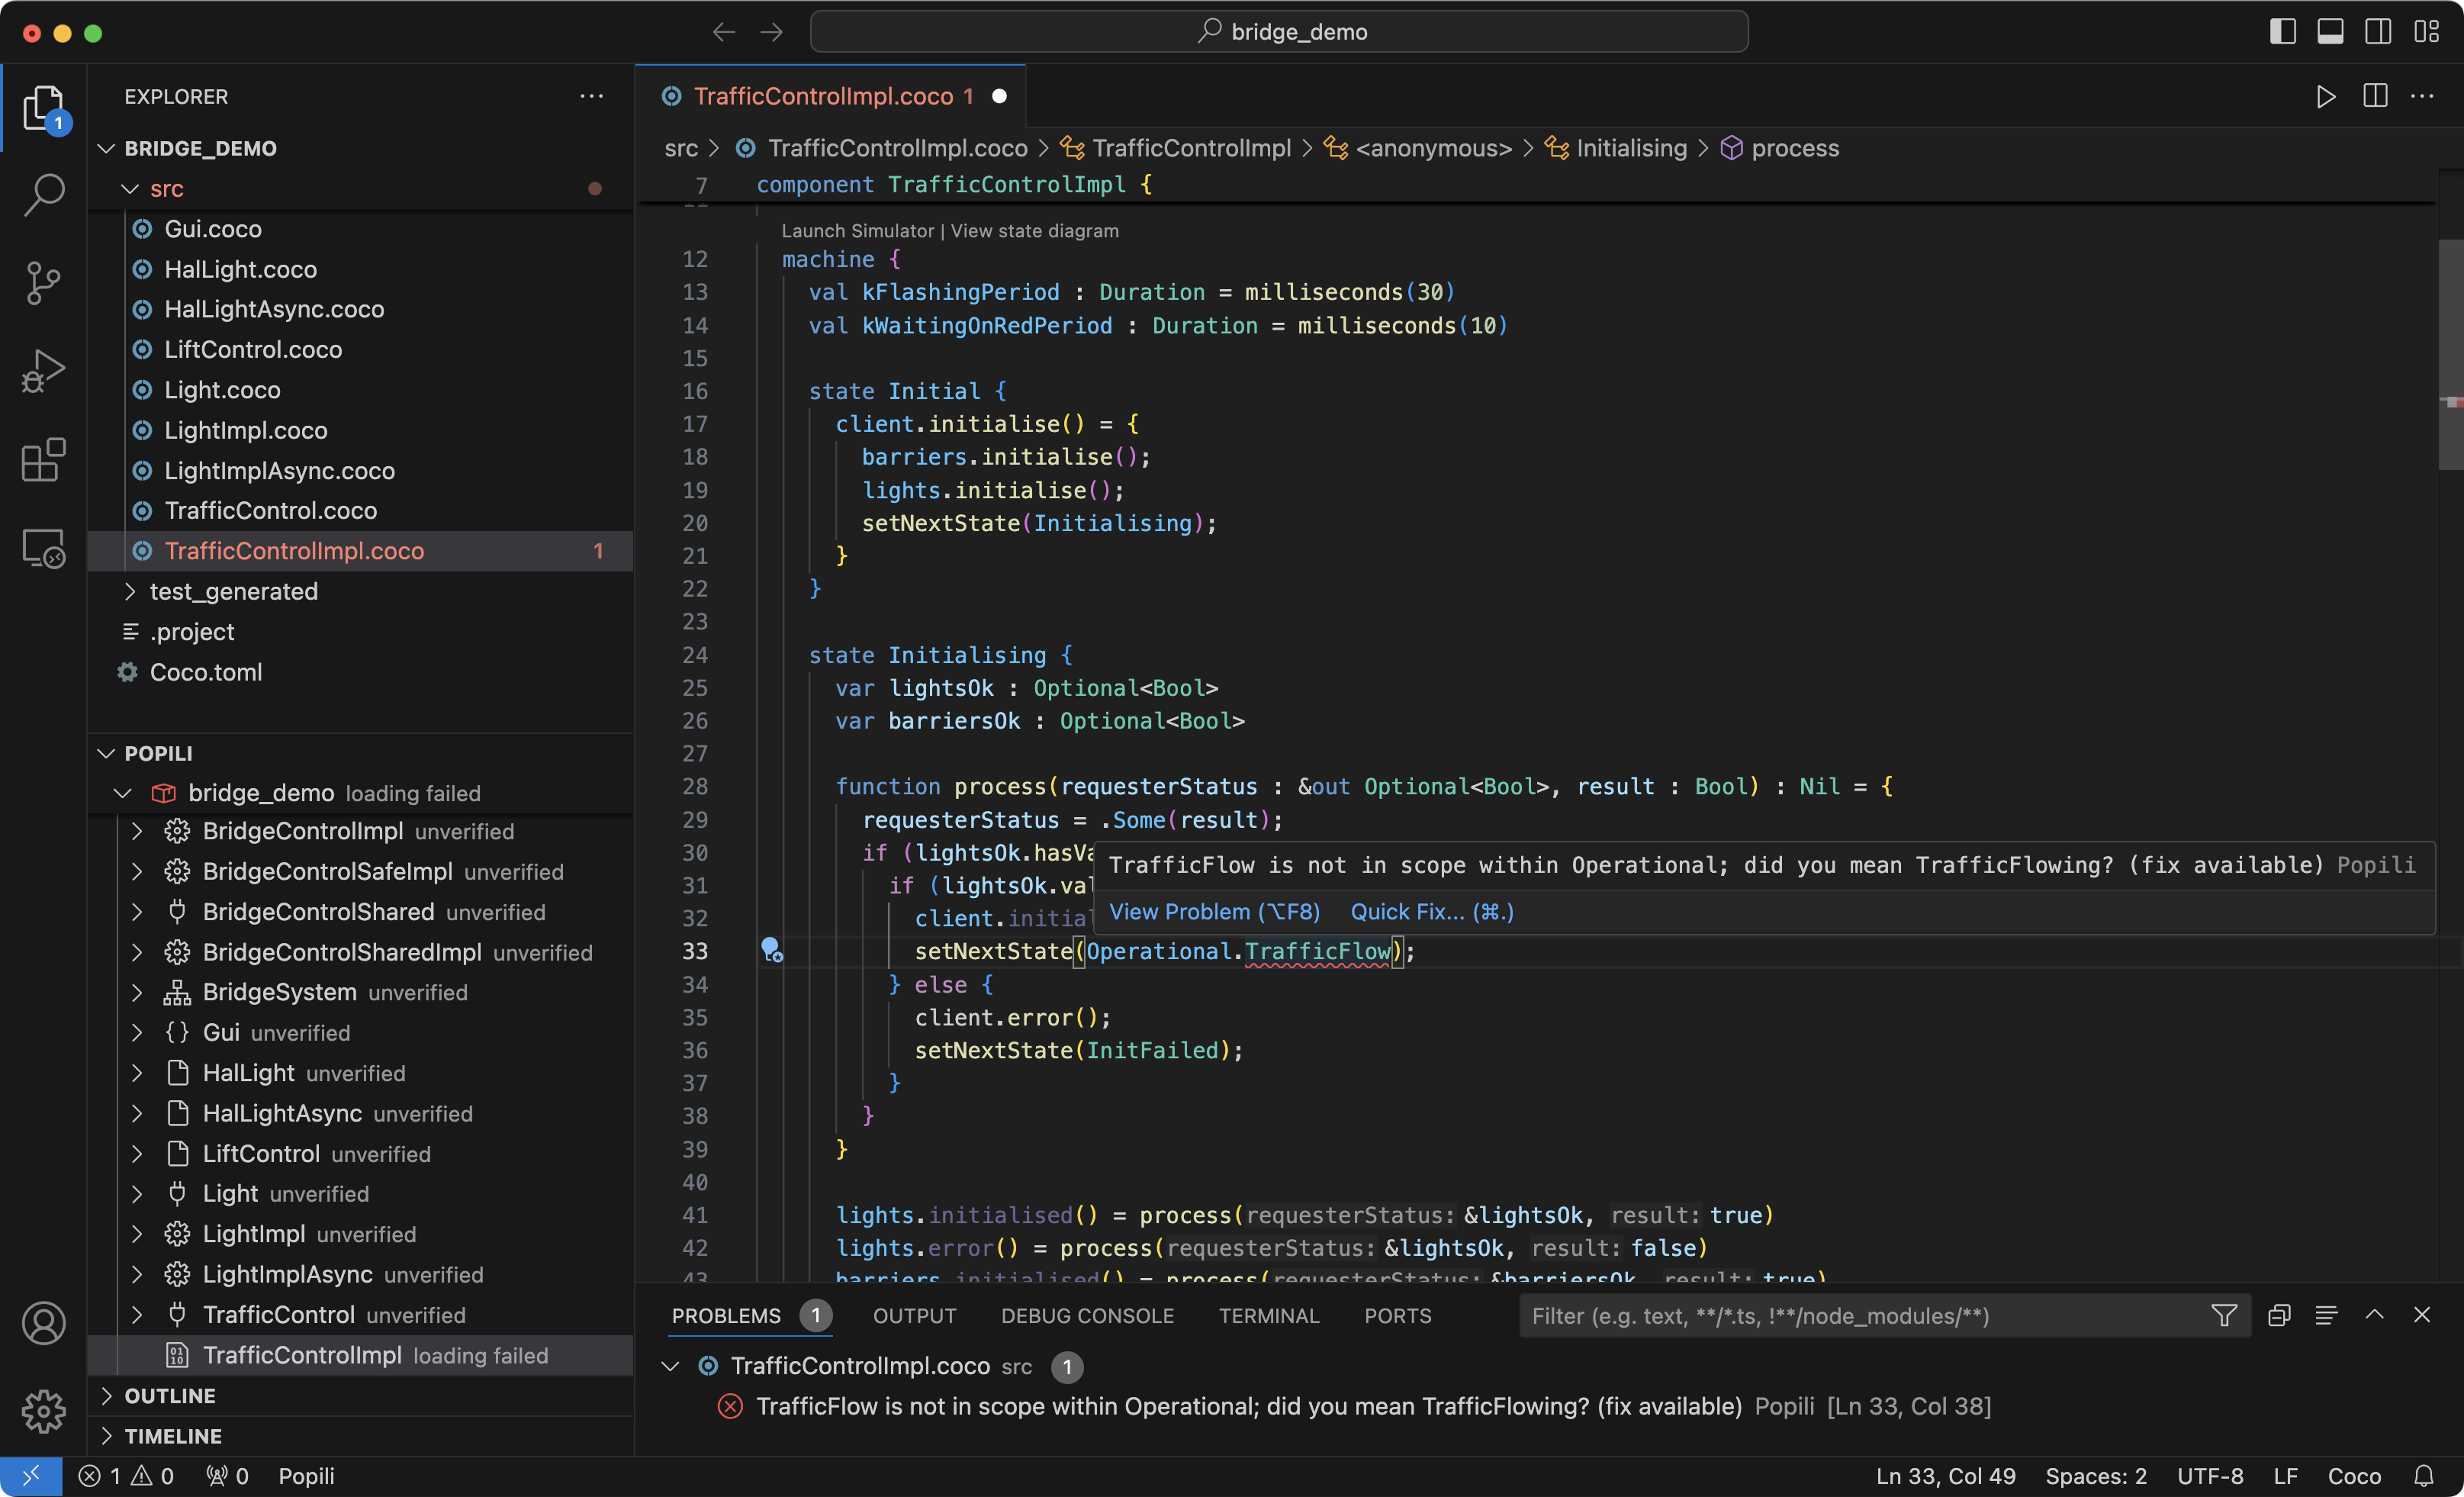
The editor performs continuous syntax and type checking as you type. By default, errors are highlighted by underlining the relevant code in red, and are also displayed in the Problems view. If you hover over an error, a tooltip describing the error will appear:
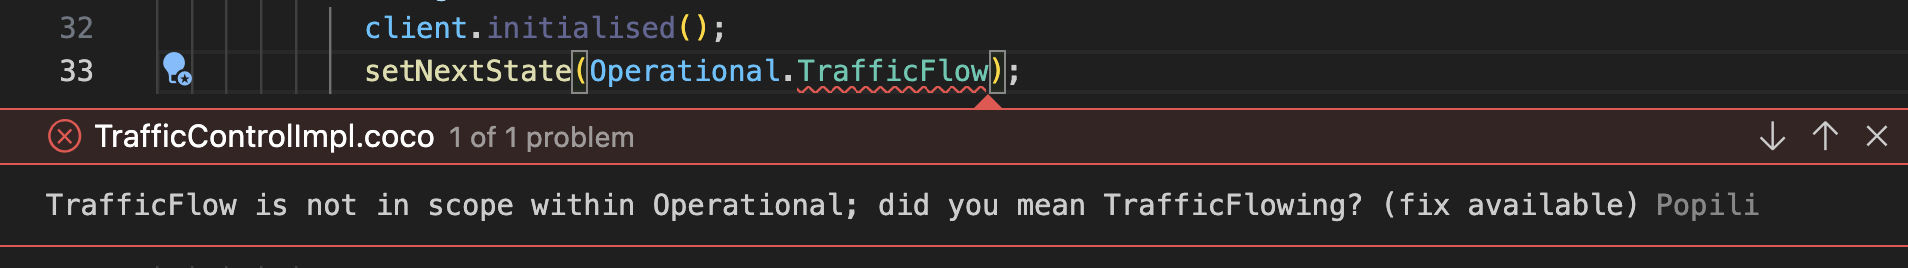
Clicking on View Problem in the tooltip will highlight the error as follows:
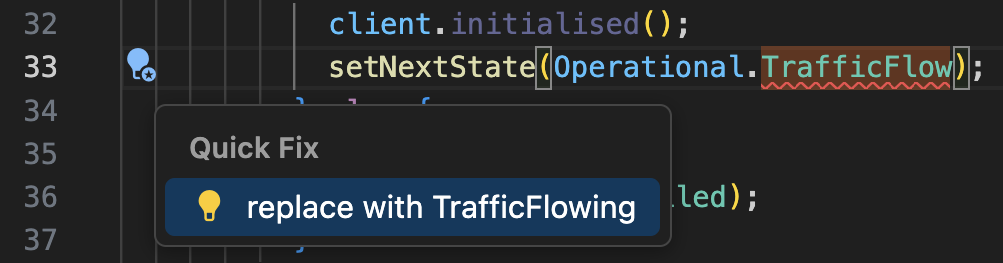
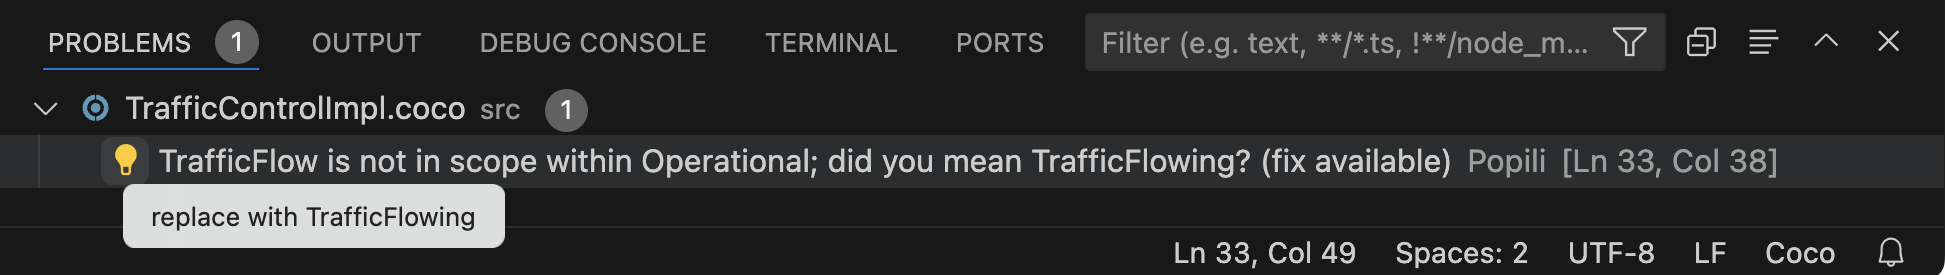
Popili will offer suggestions on how to solve errors where possible. If available, you can view and apply the suggested fix by clicking on Quick Fix in the tooltip, or the code action icon next to the corresponding line number as illustrated below:
You can also apply the quick fix suggestions errors by clicking on the error in the Problems view:
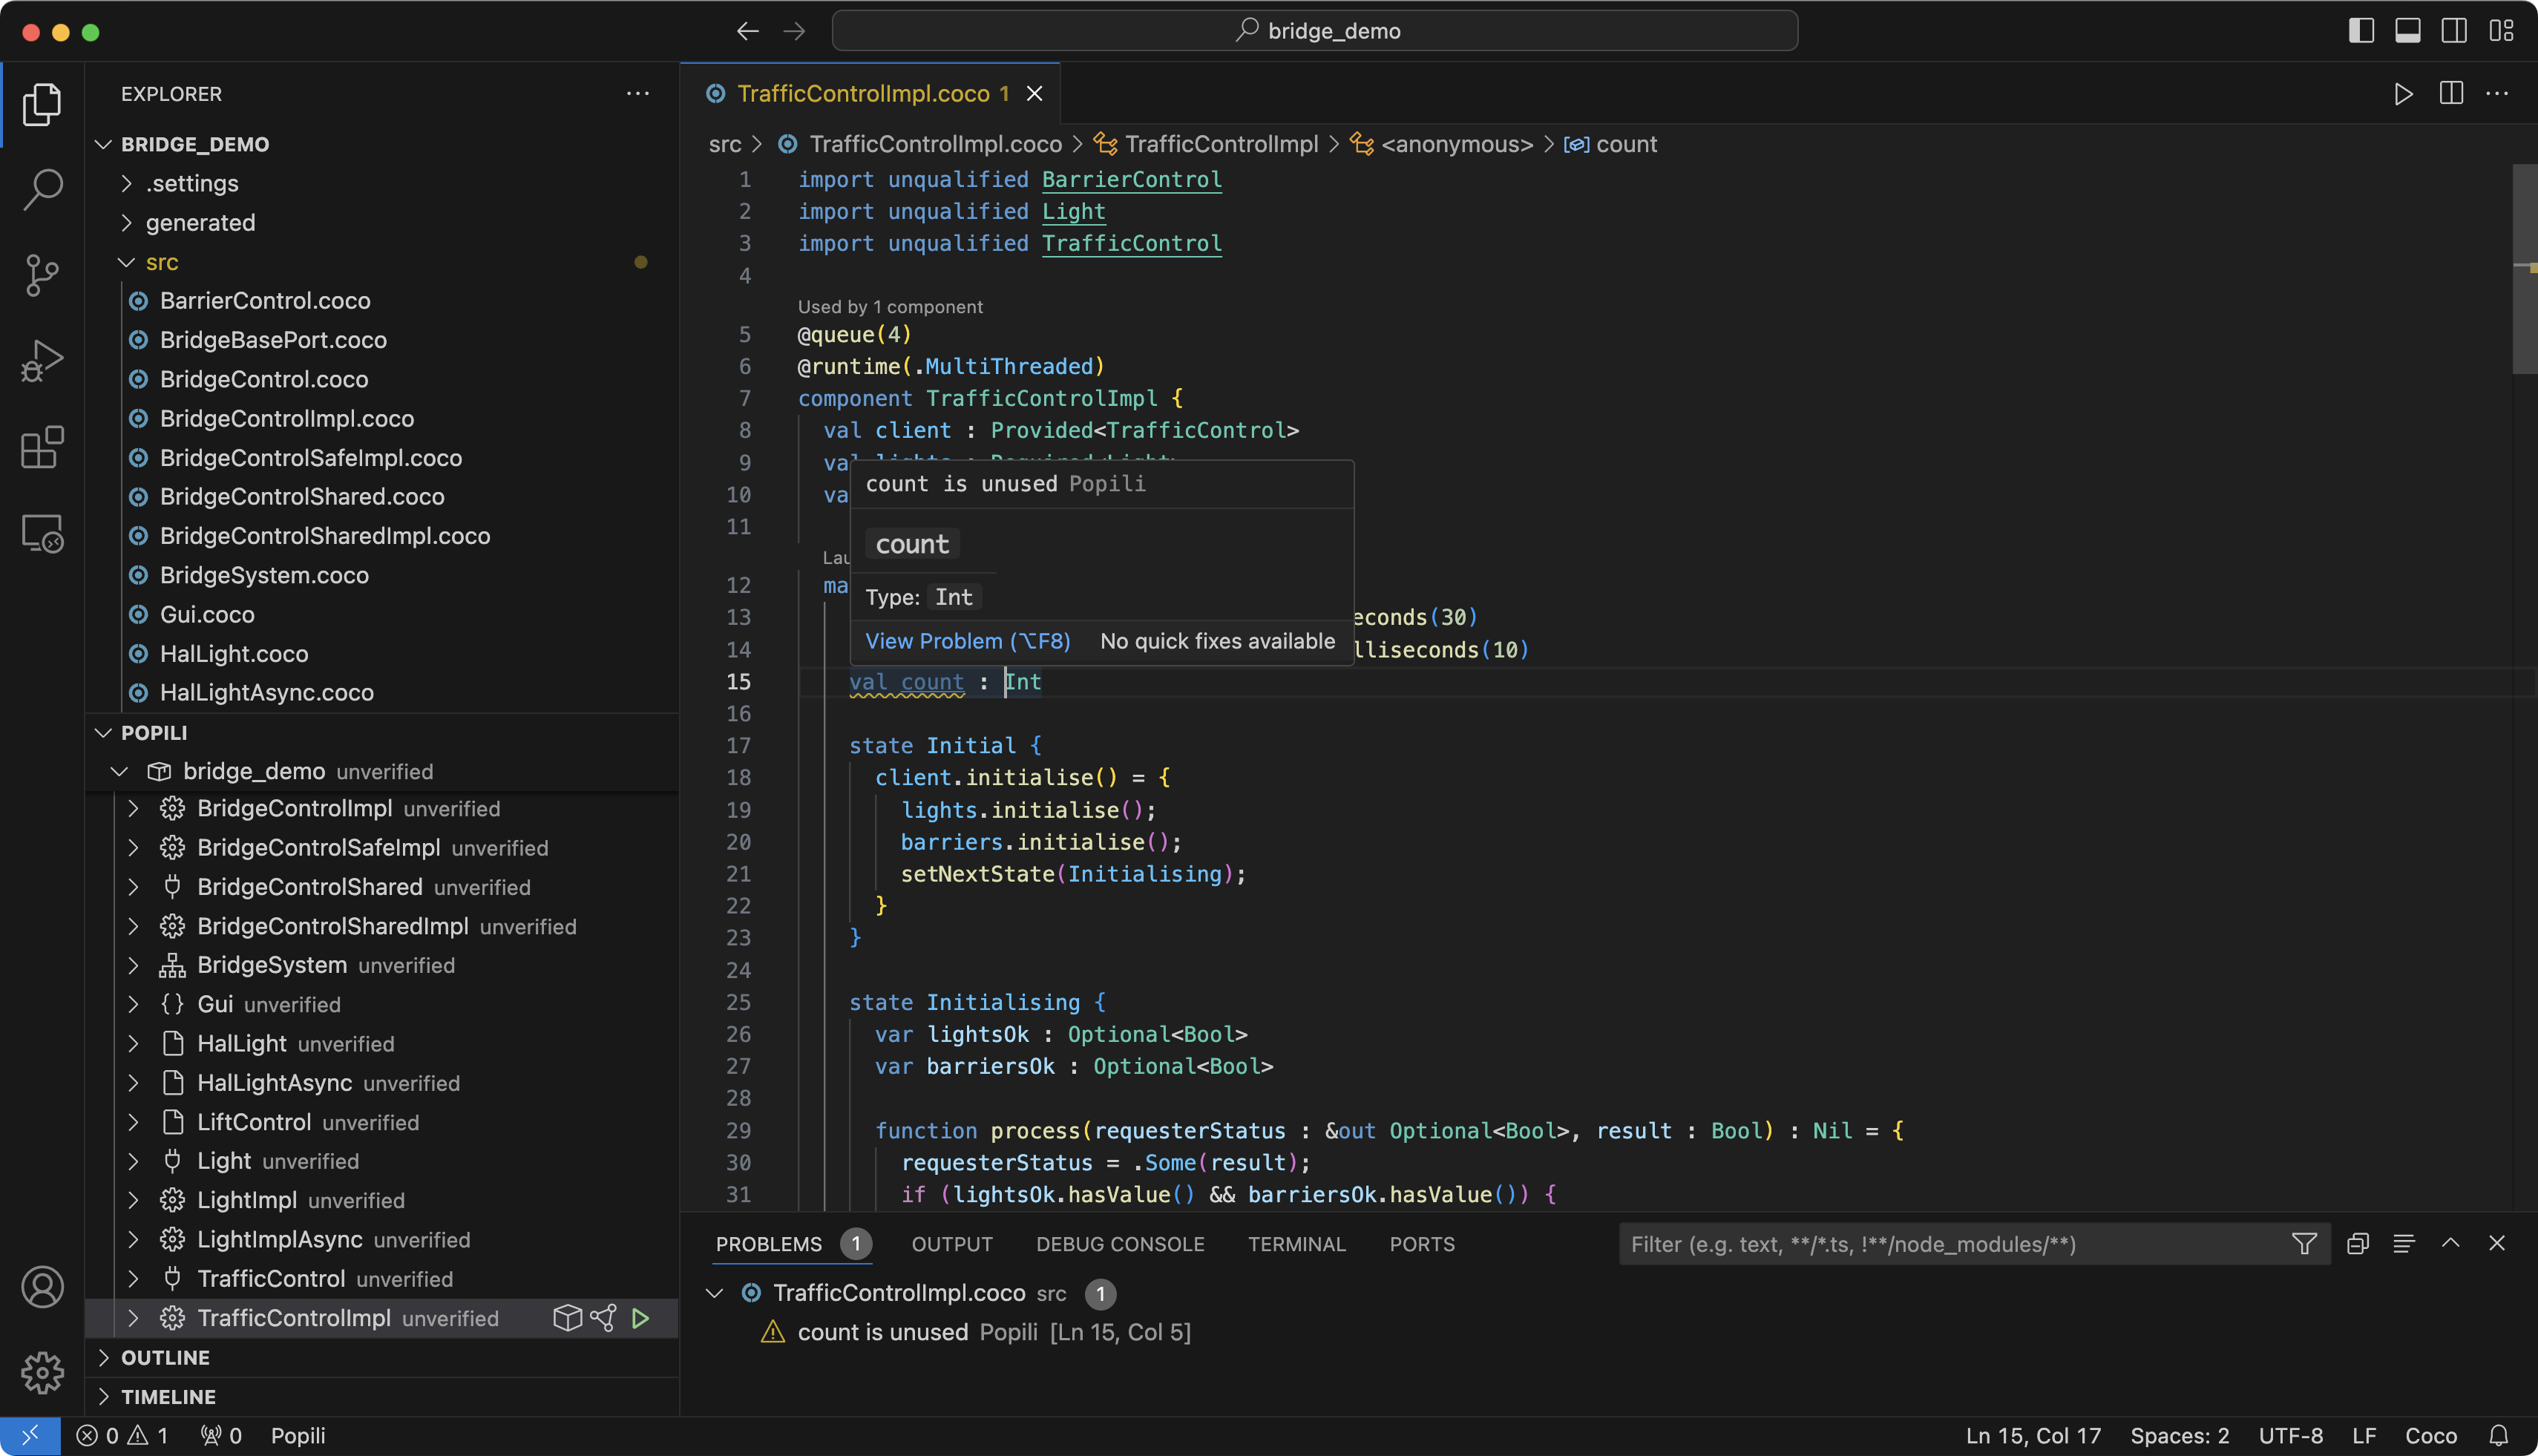
The editor also raises warnings about your code, such as identifying variables that are unused. By default, the relevant code is underlined in yellow. Clicking on the highlighted code displays a tooltip describing the warning, which is also displayed in the Problems view.
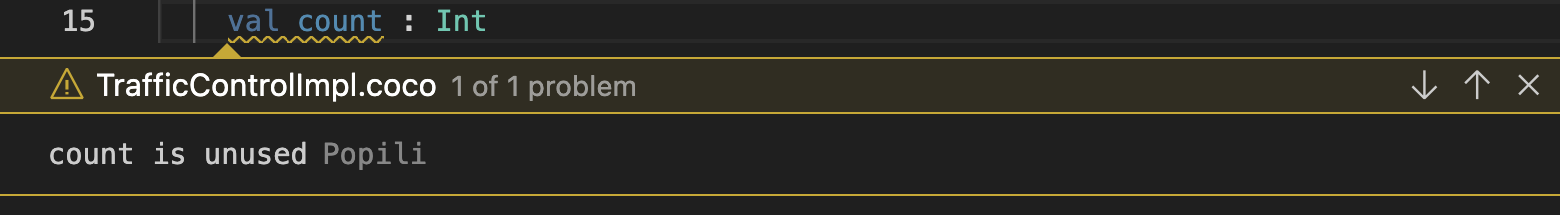
Clicking on View Problem in the tooltip will highlight the warning as follows:
Popili will also offer suggestions on how to solve warnings where possible, in the same way it does for errors.
By default, the Coco editor automatically formats your code upon every save of the Coco module. This setting can be customised VSCode’s settings.
Verifying Coco
Popili formally verifies Coco programs for a broad range of properties, ranging from runtime errors through to advanced liveness properties. A detailed overview of all the properties verified can be found in the Coco Language Reference. This section steps through how to run the verification, and view the results.
Assertions View
The Assertions view displays all the assertions that will be verified. The Assertions view is organised in hierarchy with all the Coco modules listed under their corresponding packages. Expanding a Coco module assertion reveals the ports and components within that module. If a Coco module has unresolved syntax or type errors in it, then the corresponding assertion is labelled with an error icon, and cannot be expanded. Expanding a component or port assertion reveals the individual groups of properties to be verified in each case.
Each assertion is denoted by one of the following icons representing what kind of item it is:
| Icon | Meaning |
|---|---|
| Package | |
| Folder | |
| Coco module | |
| Implementation component | |
| Encapsulating component | |
| External component | |
| Port |
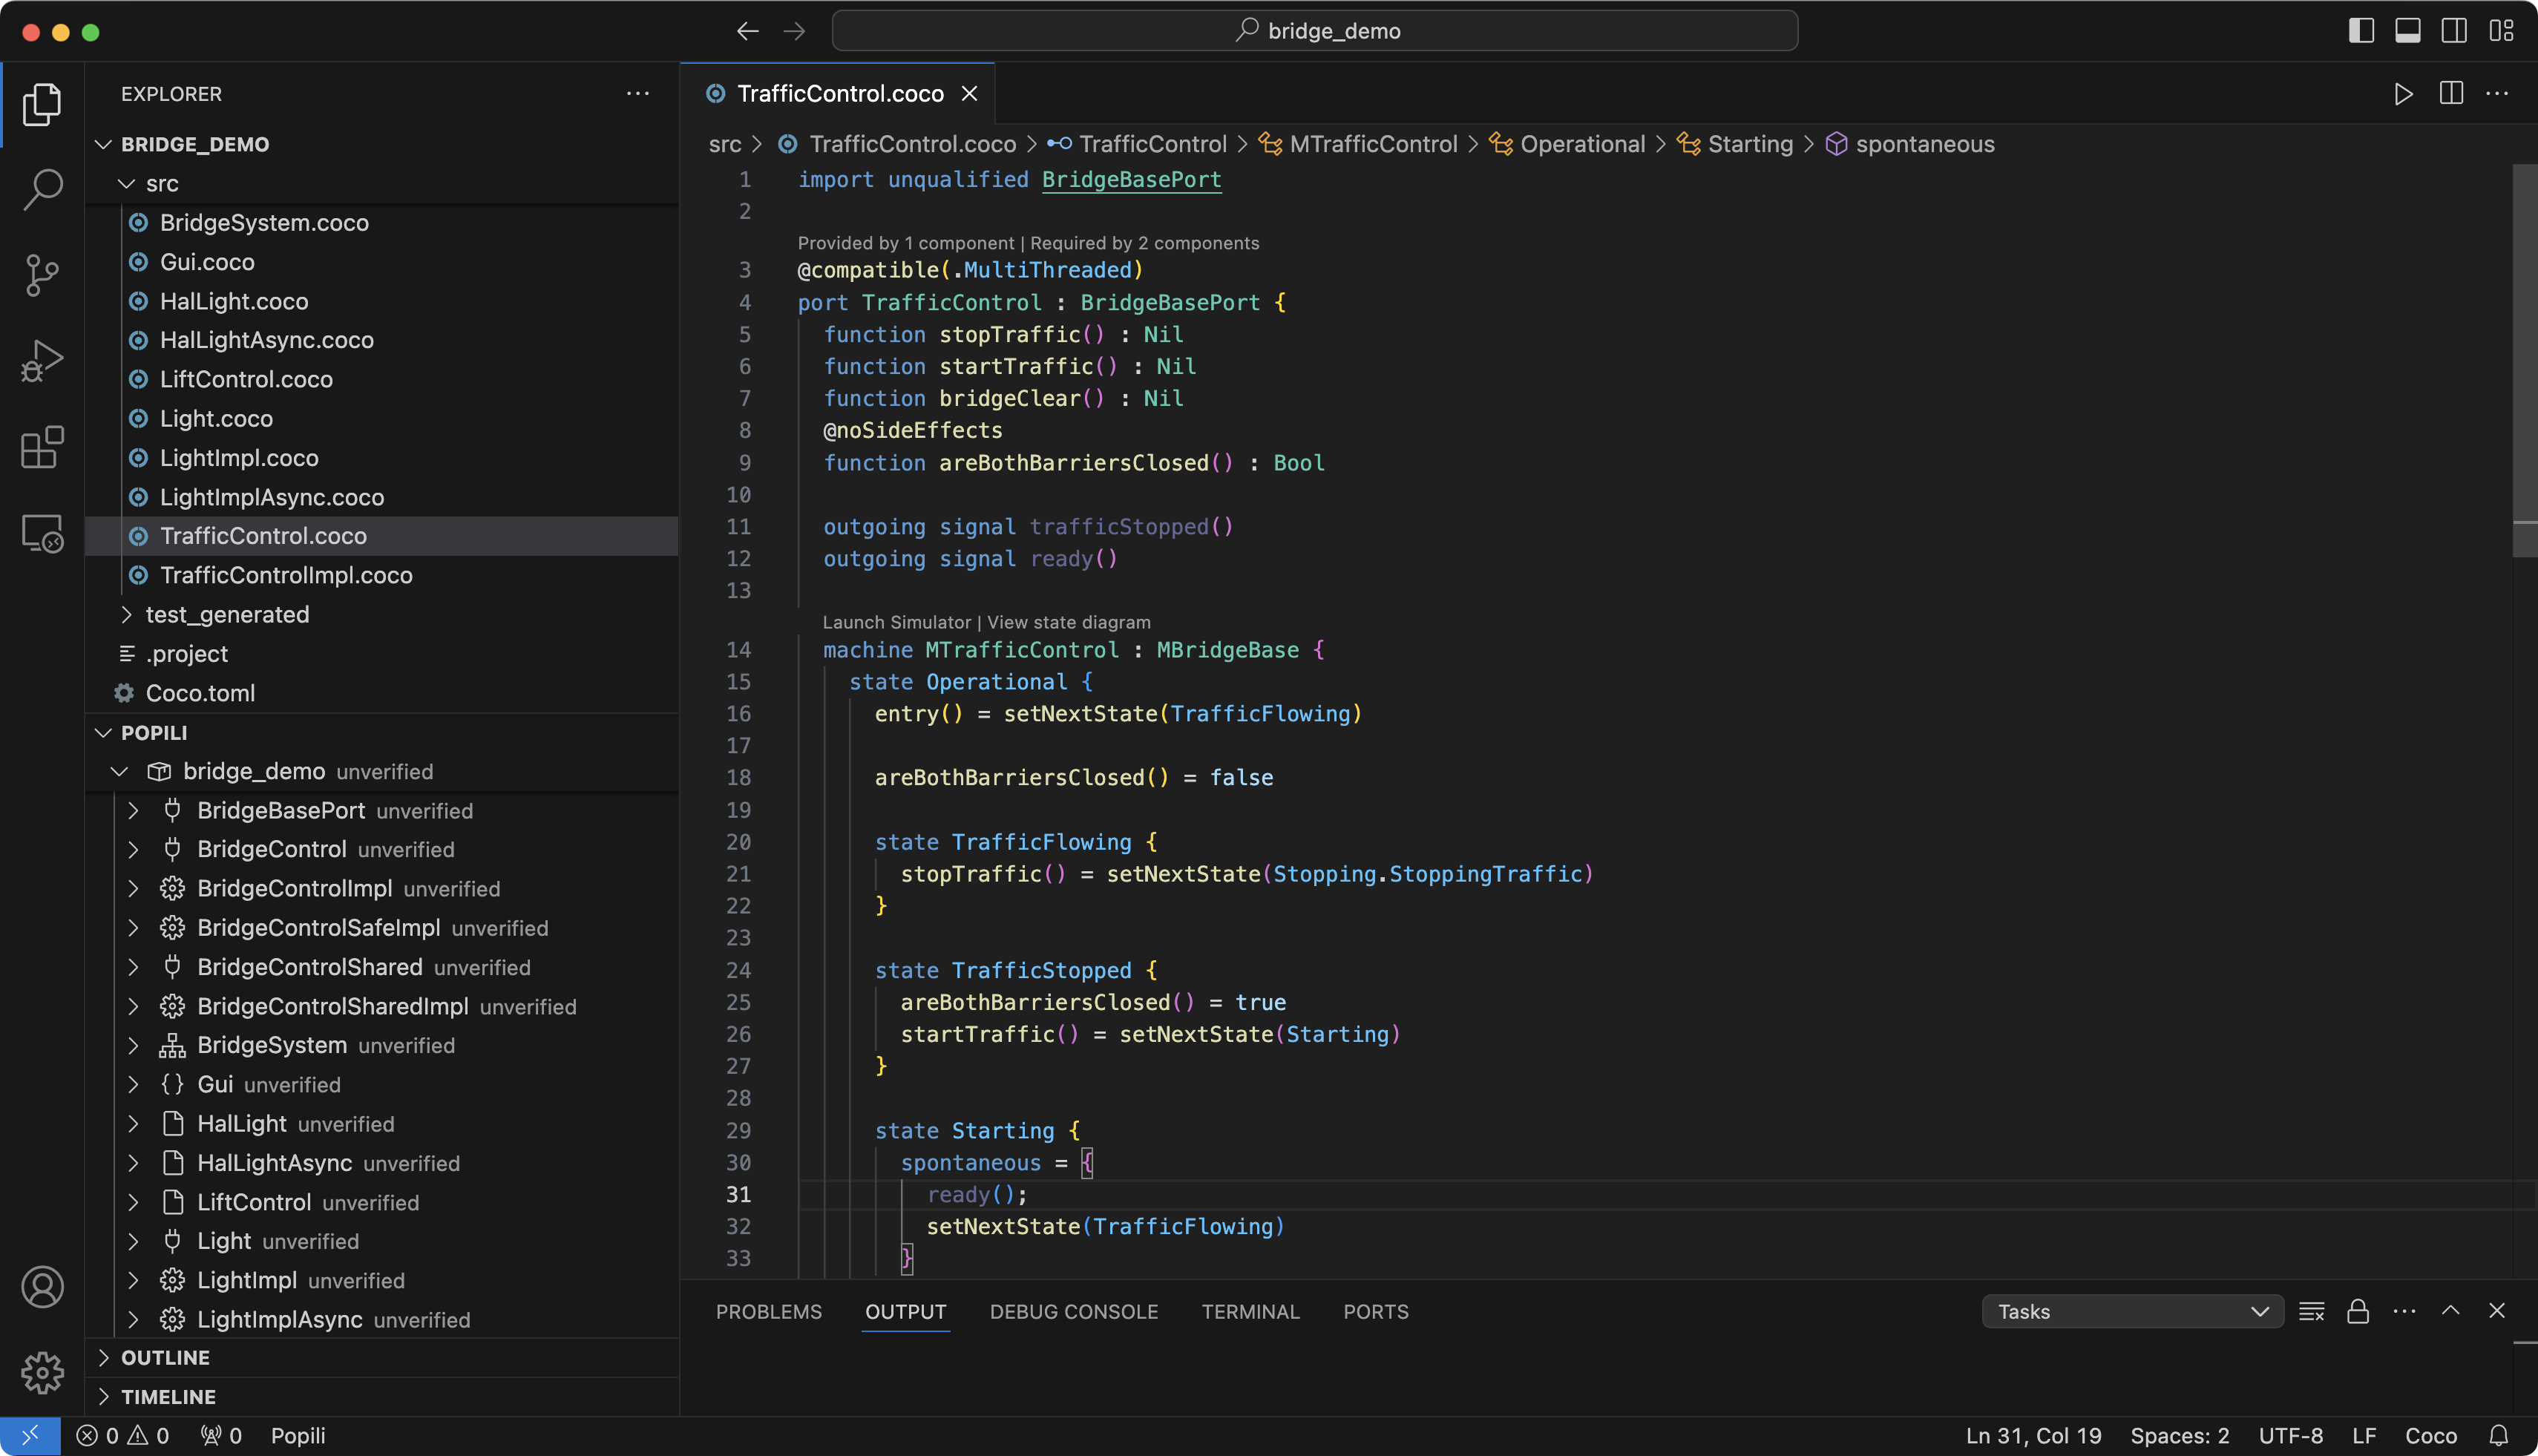
In the following example, a package with multiple Coco modules has been opened, as listed in the Explorer view.
The module called TrafficControlImpl.coco is open in the Coco Editor view, and all the assertions for the port
TrafficControl and component TrafficControlImpl have been expanded (in the Assertions view) to illustrate the
list of properties that are verified for ports and components.
If a Coco module contains a single port or component declaration with the same name as that of the containing module, then it is listed in the Assertions view directly as that corresponding port or component to avoid unnecessary nesting:
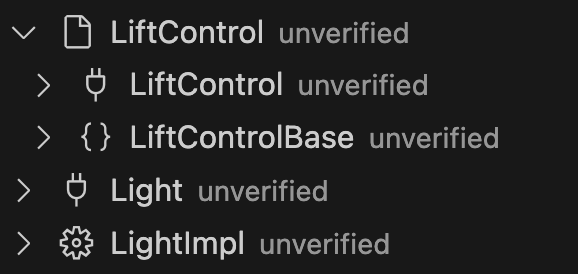
In this example above, there is a Coco module called LiftControl.coco, which contains a port called LiftControl and
an external component called LiftControlBase. In contrast, there is also a Coco module called Light.coco, which only
contains a port that is also called Light. As a result, this port is listed at the level of the modules in the hierarchy
to avoid unnecessary levels of nesting. The same applies to the implementation component LightImpl in this example above.
The Assertions view has the following buttons in its toolbar:
| Icon | Meaning |
|---|---|
| Runs the verification for all of the assertions listed in Popili’s Assertions view. If you hover your cursor over this icon, then you will see a tooltip appear highlighting this. | |
Generates the code for your project. The code will be generated into the locations specified in the Coco.toml
file, defaulting to generated if not otherwise specified. |
|
| Displays the verification results in a table. | |
| Contracts the hierarchy of assertions back to listing the top level of assertions only. |
Run the Verification
The verification can only be run on Coco projects and modules that do not have any static errors in them. Assertions for modules that do have such errors are labelled with , and will also have corresponding error messages in the modules themselves.
There are several ways to run the verification:
- Click on in the Assertions view toolbar to verify the entire Coco project.
- Click on for any individual assertion in the assertions tree to limit the verification to a single Coco module, port, component, or property. This will verify the selected assertion, together with any other assertions that it depends upon. For example, when verifying a component assertion, the verification will also verify all ports that are provided or required by that component.
- Open the Command Palette and search for Popili:Verify All or Popili:Verify File.
- Use the keyboard shortcuts Shift+Alt+R on Linux, Ctrl+Alt+R on Windows, or Cmd+Shift+R on MacOS to verify the entire project, Ctrl+R on Linux and Windows, or Cmd+R on MacOS to verify the current Coco file selected.
To see or customise the keyboard shortcuts, open VSCode’s keyboard settings.
The following table summarises the possible results and corresponding icons that assertions can be labelled with:
| Icon | Assertion Status |
|---|---|
| The Coco module has static errors in it, and therefore cannot be verified. | |
| The Coco module imports another module containing static errors, therefore also cannot be verified. | |
| The verification is currently running. | |
| Passed the verification successfully. | |
| Failed the verification with a warning. | |
| Failed the verification with an error. | |
| The verification failed due to an error in the Coco module. | |
| Not verified due to a verification failure of an assertion that it depends upon. | |
| The verification failed due to an error with the remote verification service. | |
| An internal error occurred during the verification. | |
| A timeout occurred whilst running the verification. | |
| Verification consumed too much memory and was therefore aborted. |
Popili runs the verification for the assertions in a specific order, reflecting the dependencies between them. If an assertion fails, then all assertions that depend upon it passing the verification successfully will not be verified, and are labelled with accordingly.
By default, Popili will not rerun the verification for assertions that have cached verification results, thereby making the verification faster and more efficient, particularly when run on large packages. Assertions are labelled accordingly to indicate whether cached verification results are available, and if so what the results are. This can be overridden by holding down the Shift key when clicking the green play button in the Assertions view toolbar.
When editing Coco modules that have already been verified, Popili intelligently identifies which assertions are impacted by the changes made. For example, any changes made to comments in a module would not impact the verification results of any of the assertions. Only assertions impacted by the changes will become labelled with again when the changes are saved, and will therefore have to be reverified.
Verification Statistics
You can view verification statistics for your Coco project by clicking on while the verification is running and upon its completion:
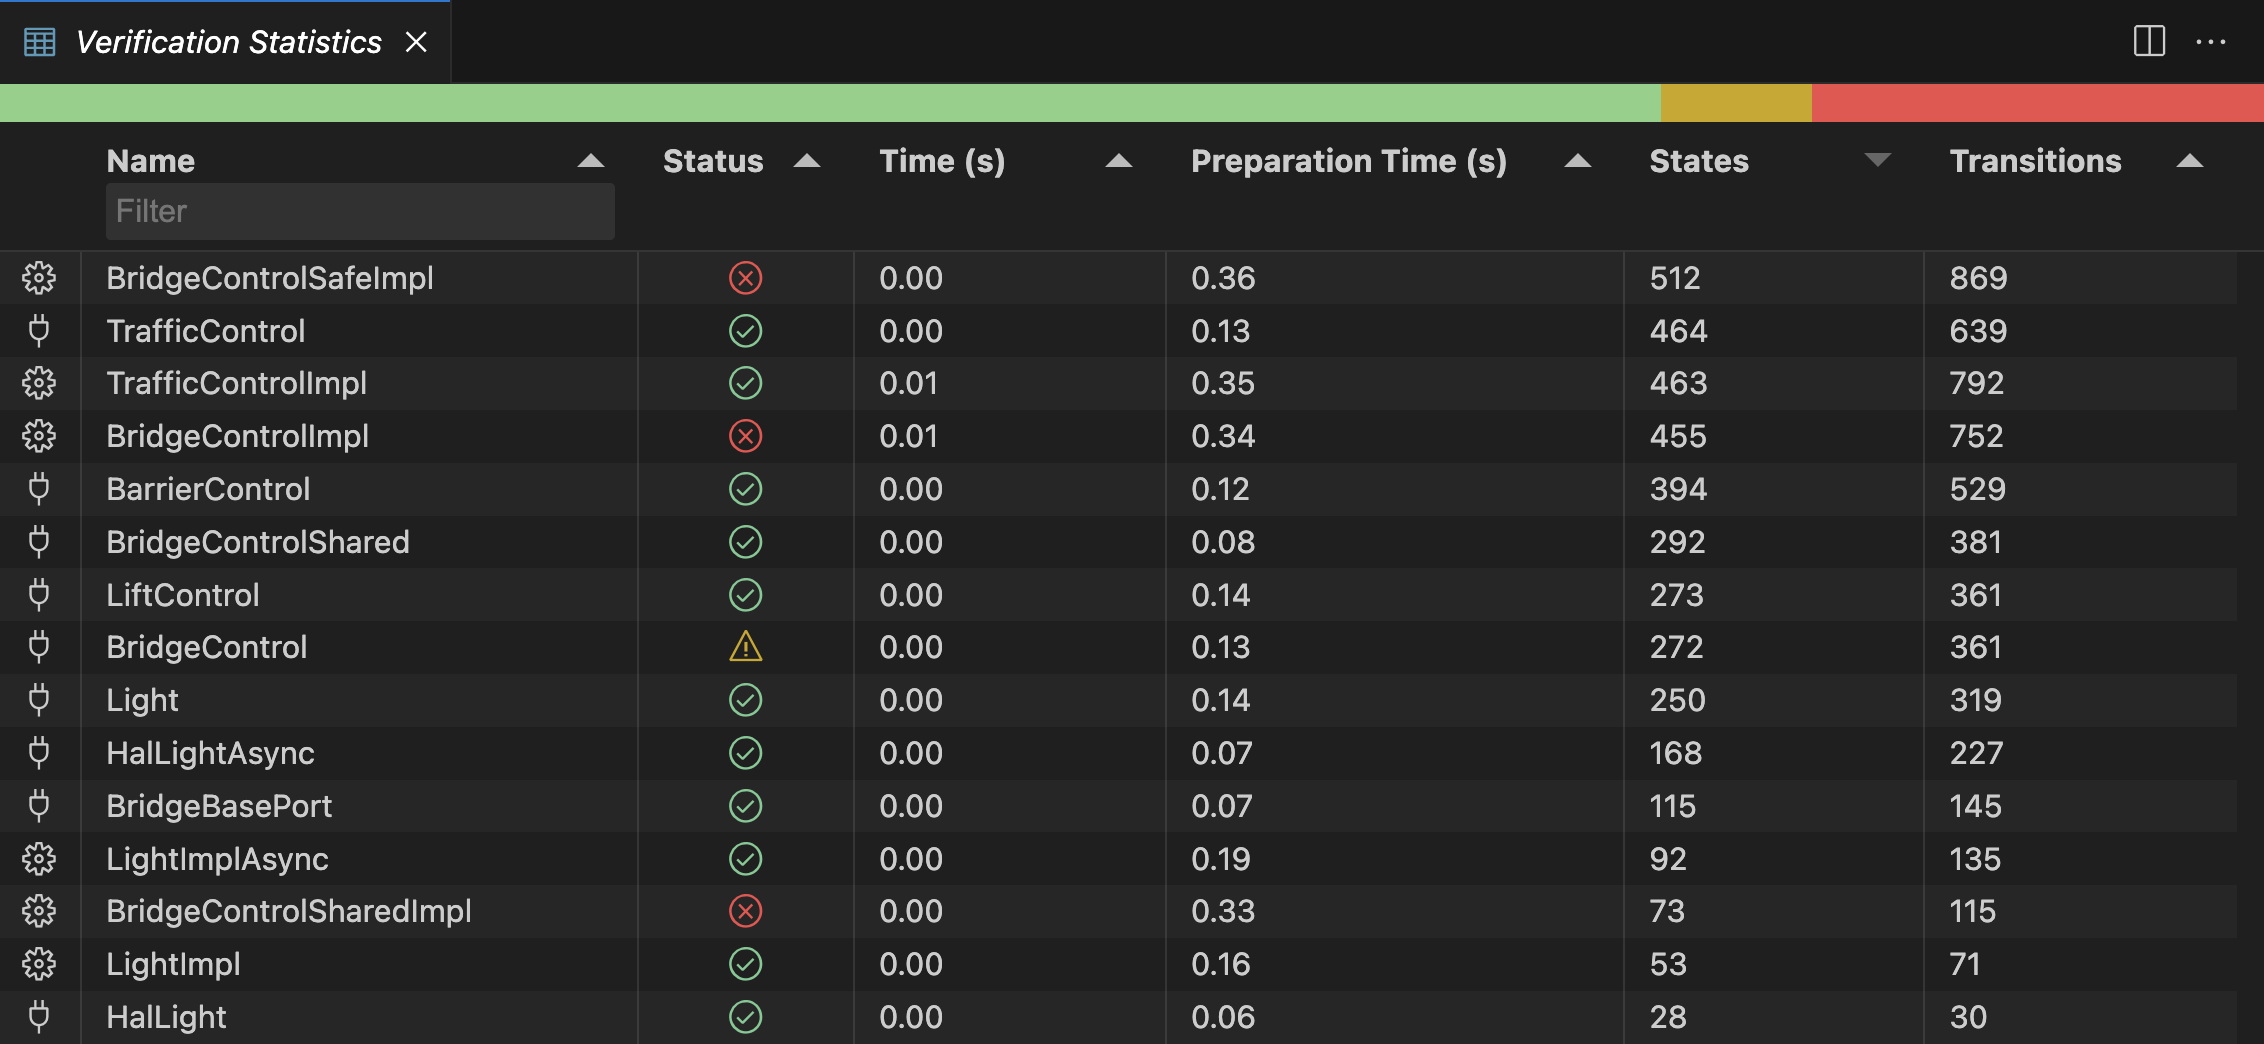
While the verification is running, the progress bar summarises the status of the verification as follows:
| Colour | Meaning |
|---|---|

|
Preparing the verification. |

|
Verification completed with an error. |

|
Verification completed with a warning. |

|
Verification completed and passed. |
Further, for every port and component being verified in your project, this table also presents a summary of: its verification status; the time taken (in seconds) for the verification to be executed, excluding the preparation phase; the time taken (in seconds) to prepare the verification; the number of states visited; and the number of transitions visited.
Counterexamples View
When the verification has finished, the assertions in the Assertions view are labelled with icons indicating the verification results, which are described in the assertions results table above. Running the verification on all of the assertions for our TrafficControlImpl example leads to the following results:
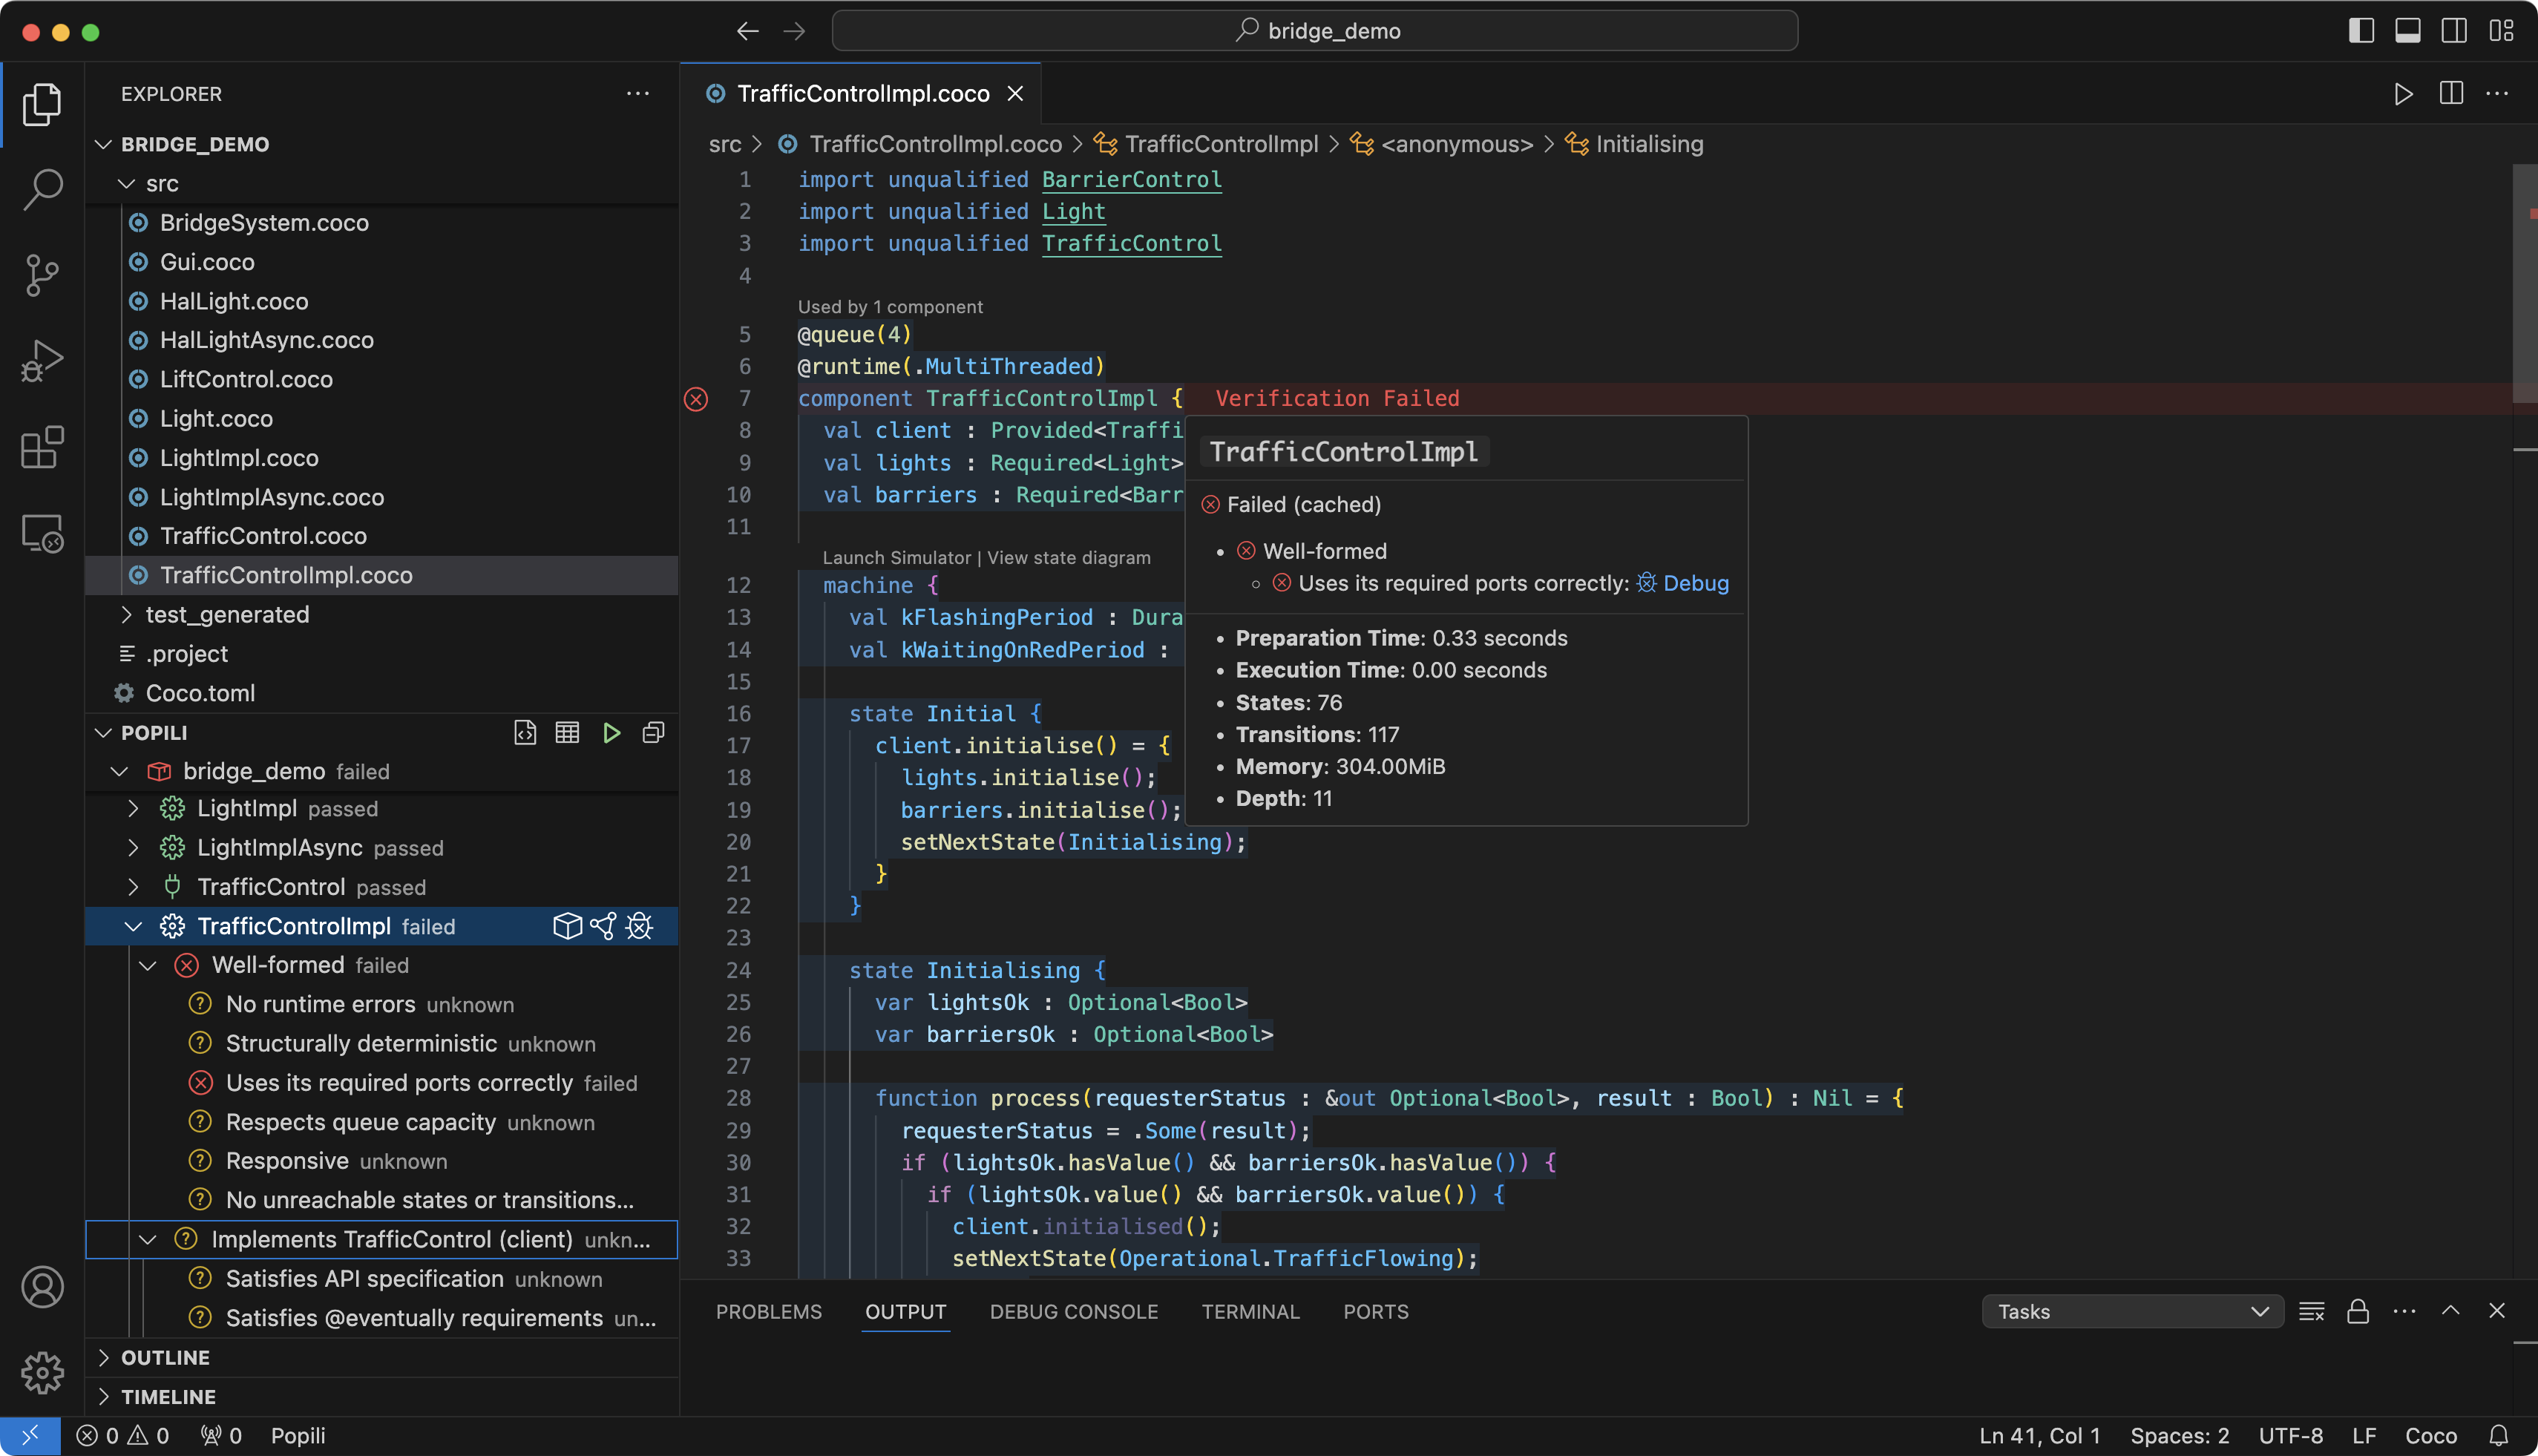
As illustrated above, if you hover your cursor over any of the assertions, then a tooltip will be displayed providing a
brief description of the property being verified, its verification status, and additional information about the verification
including the number of states and transitions visited, and the time taken to verify the selected assertion. In this example,
one of the well-formedness assertions for the TrafficControlImpl component has failed (denoted by ).
As a result, a number of other assertions that are dependent upon this one were not able to be verified
(denoted by ).
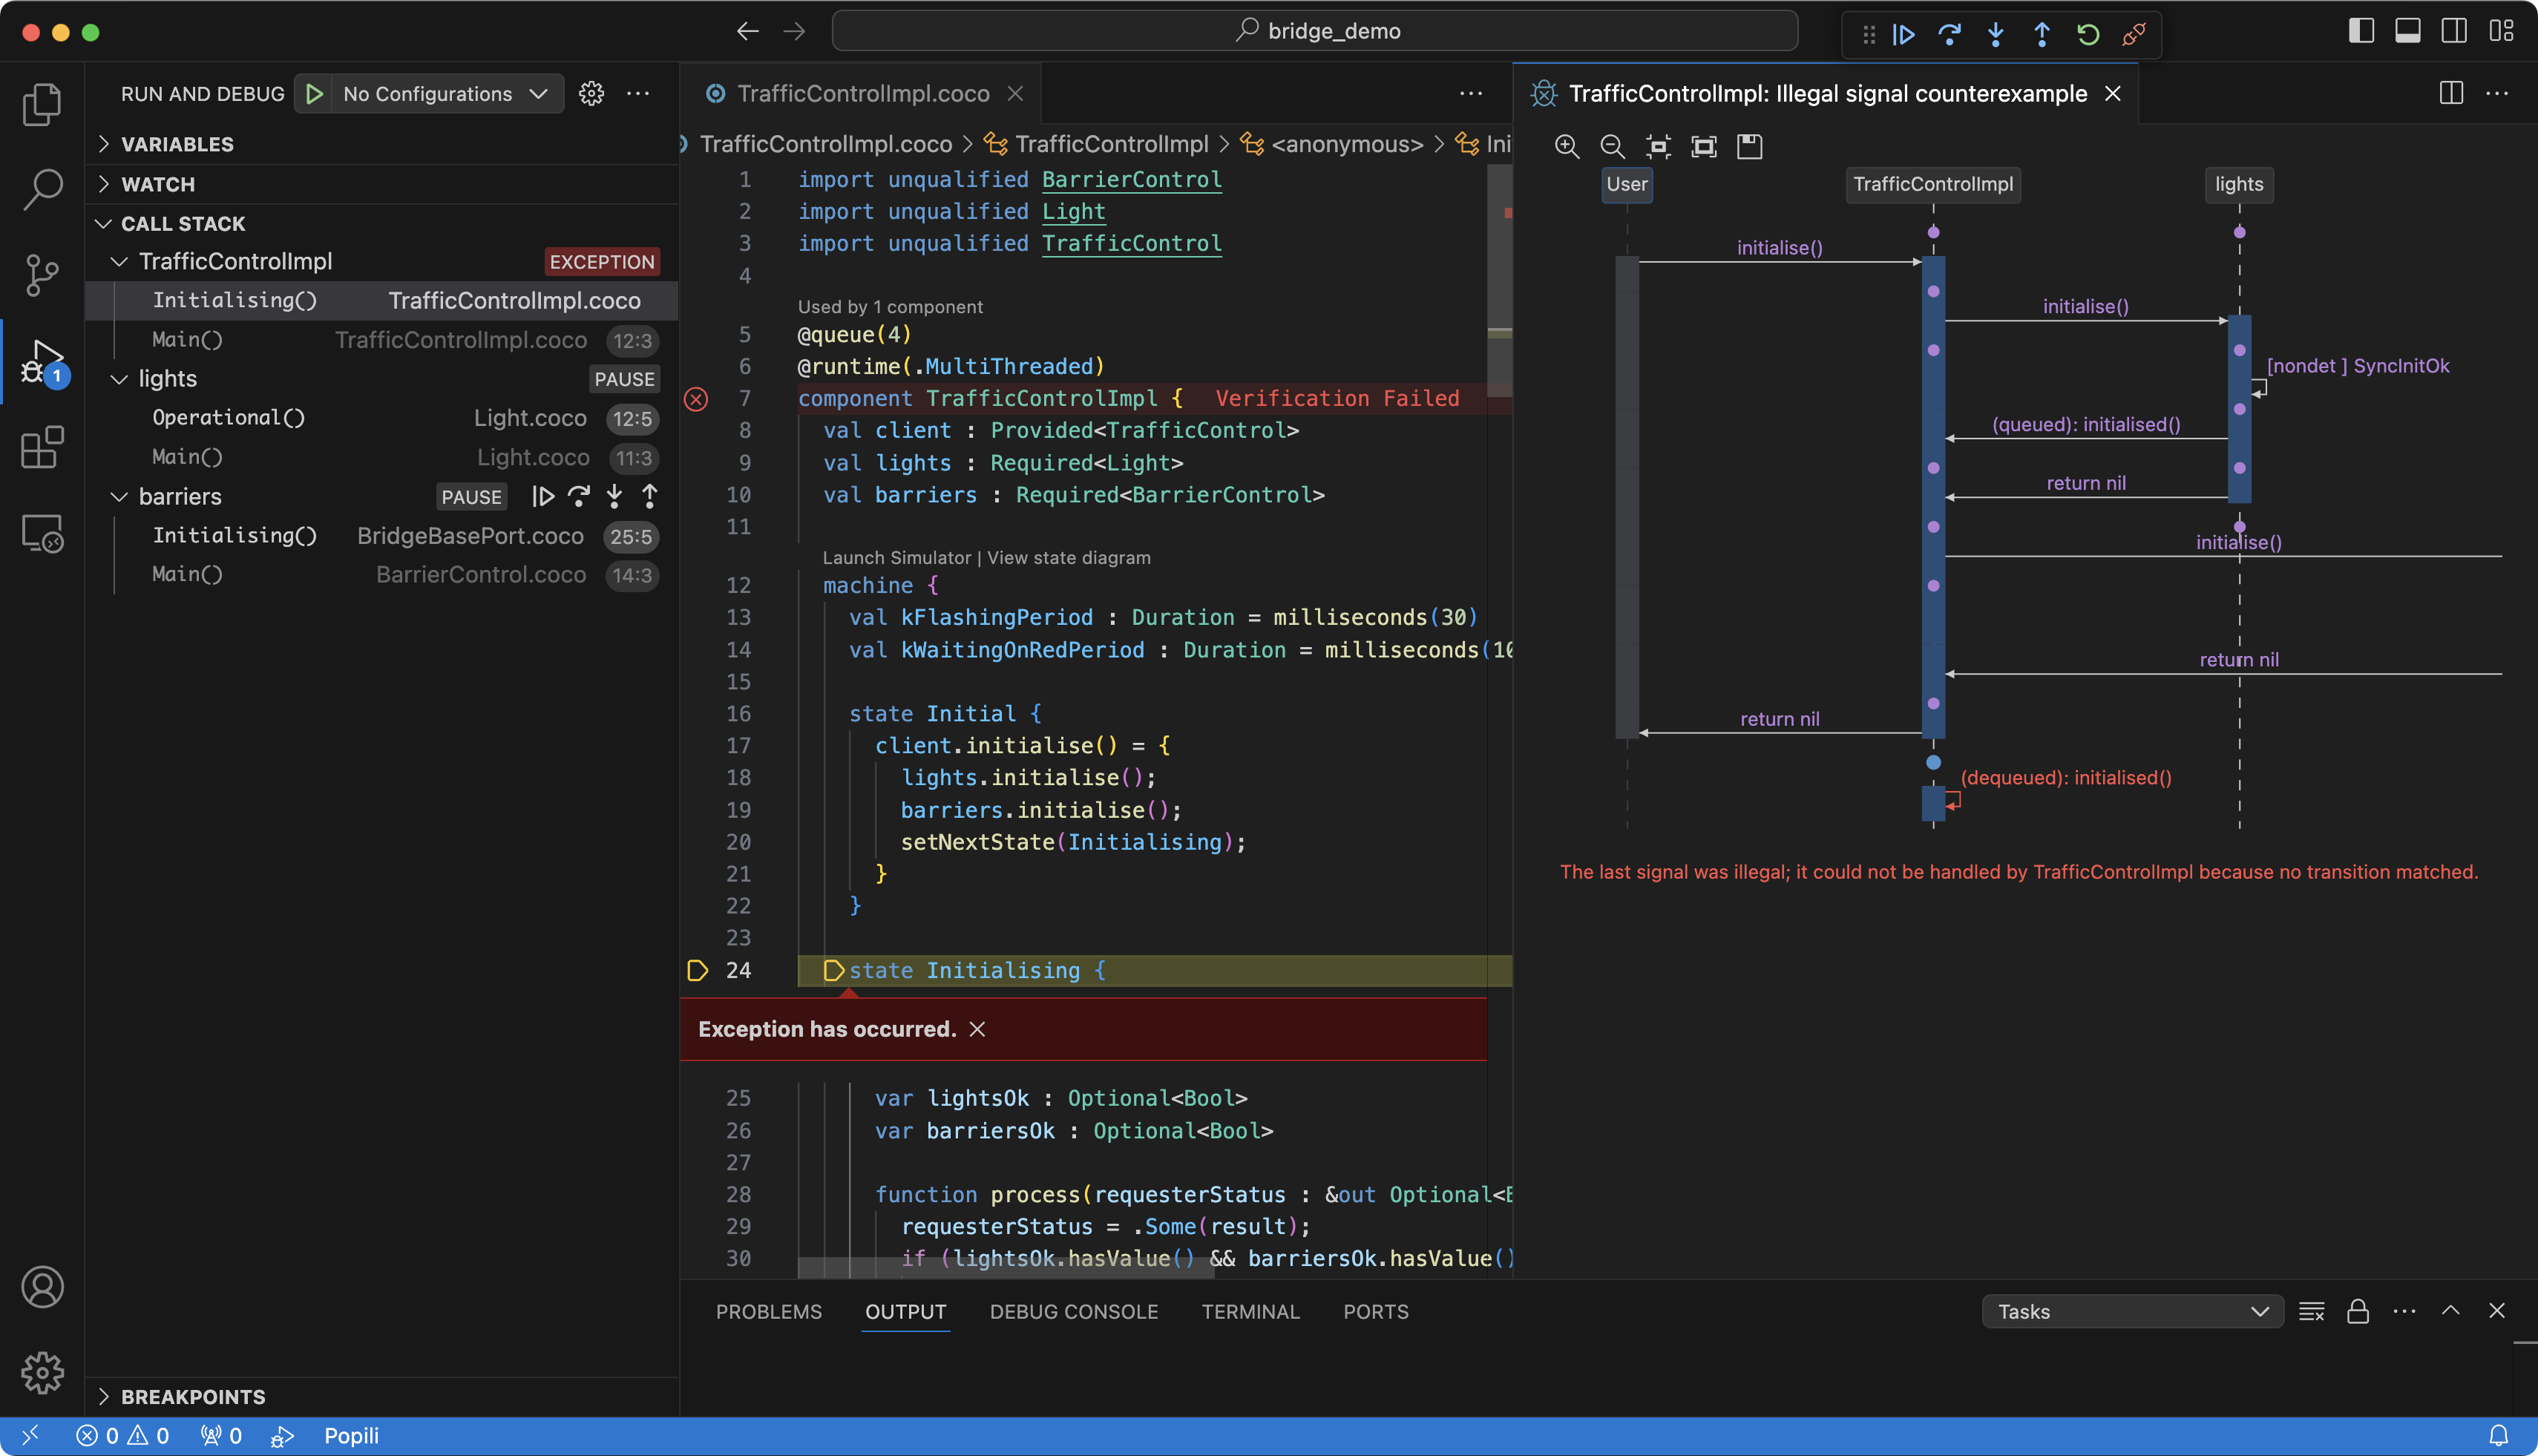
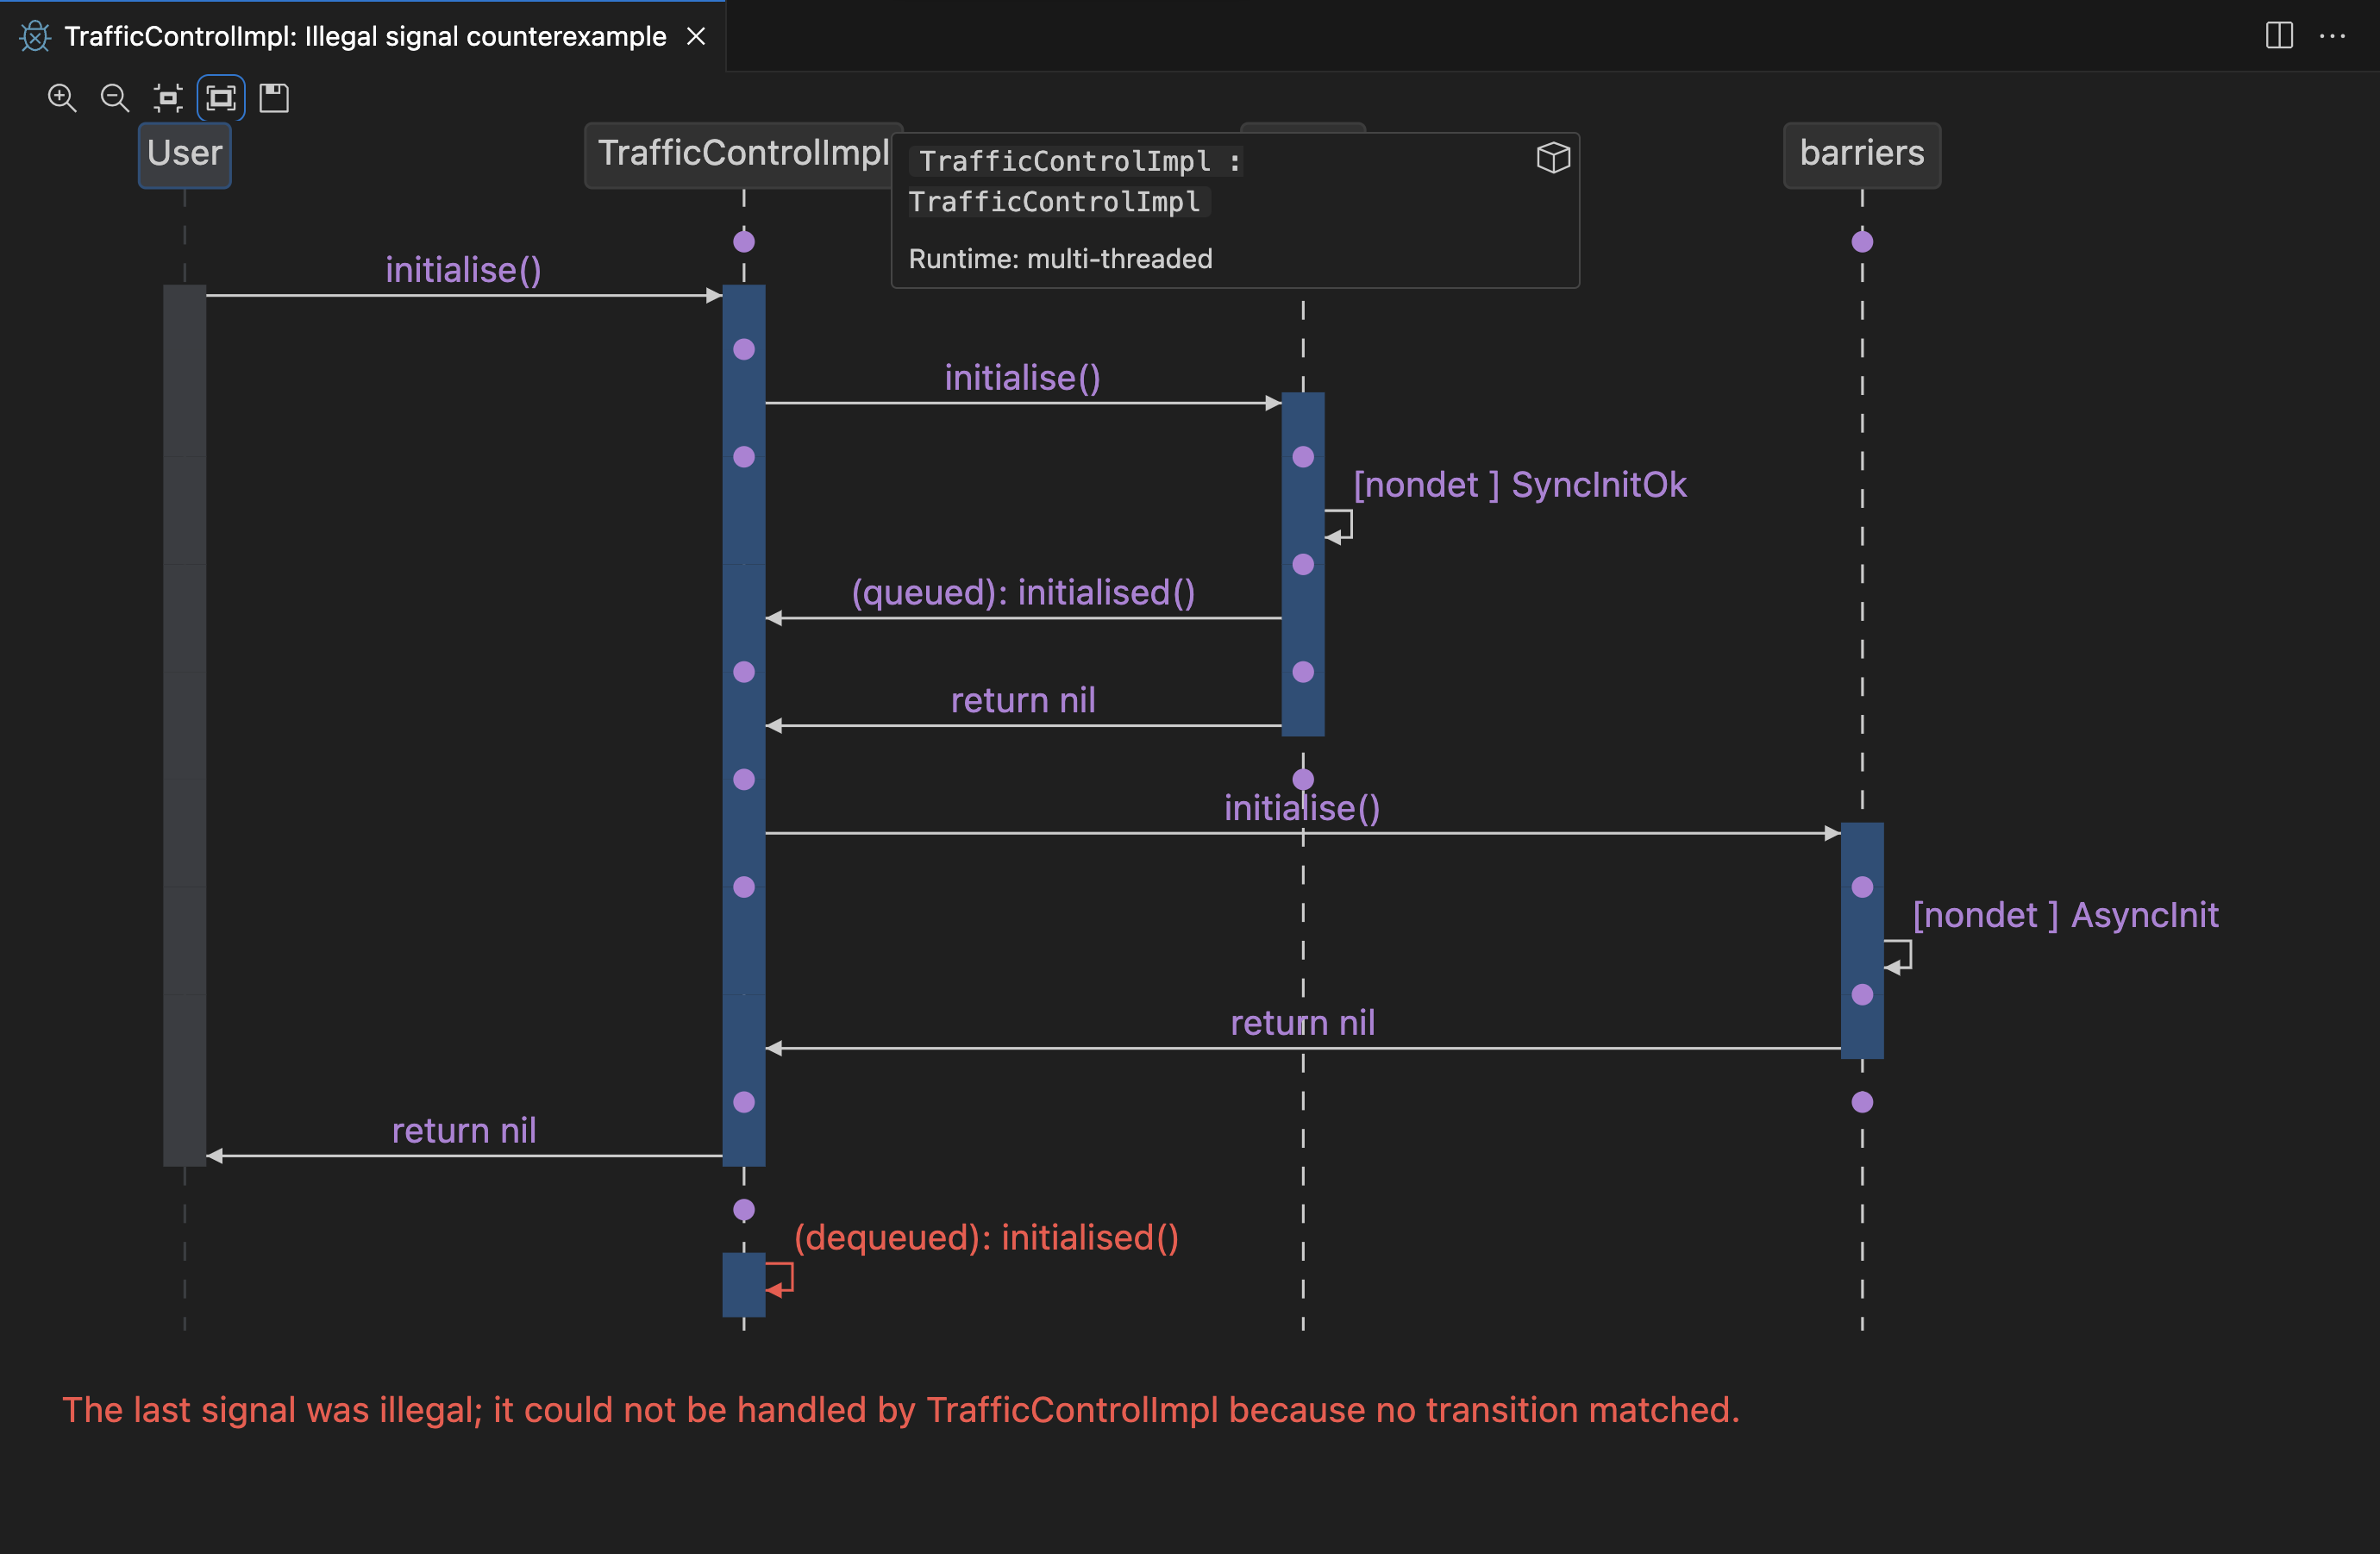
If an assertion has failed with a verification error, then you can view extensive debugging information describing the error using Popili’s debugger. This can be launched by clicking on the Launch Debugger button (denoted by ) that appears when hovering over the failed assertion in the Assertions view. Using our example above, the following counterexample of the error is displayed:
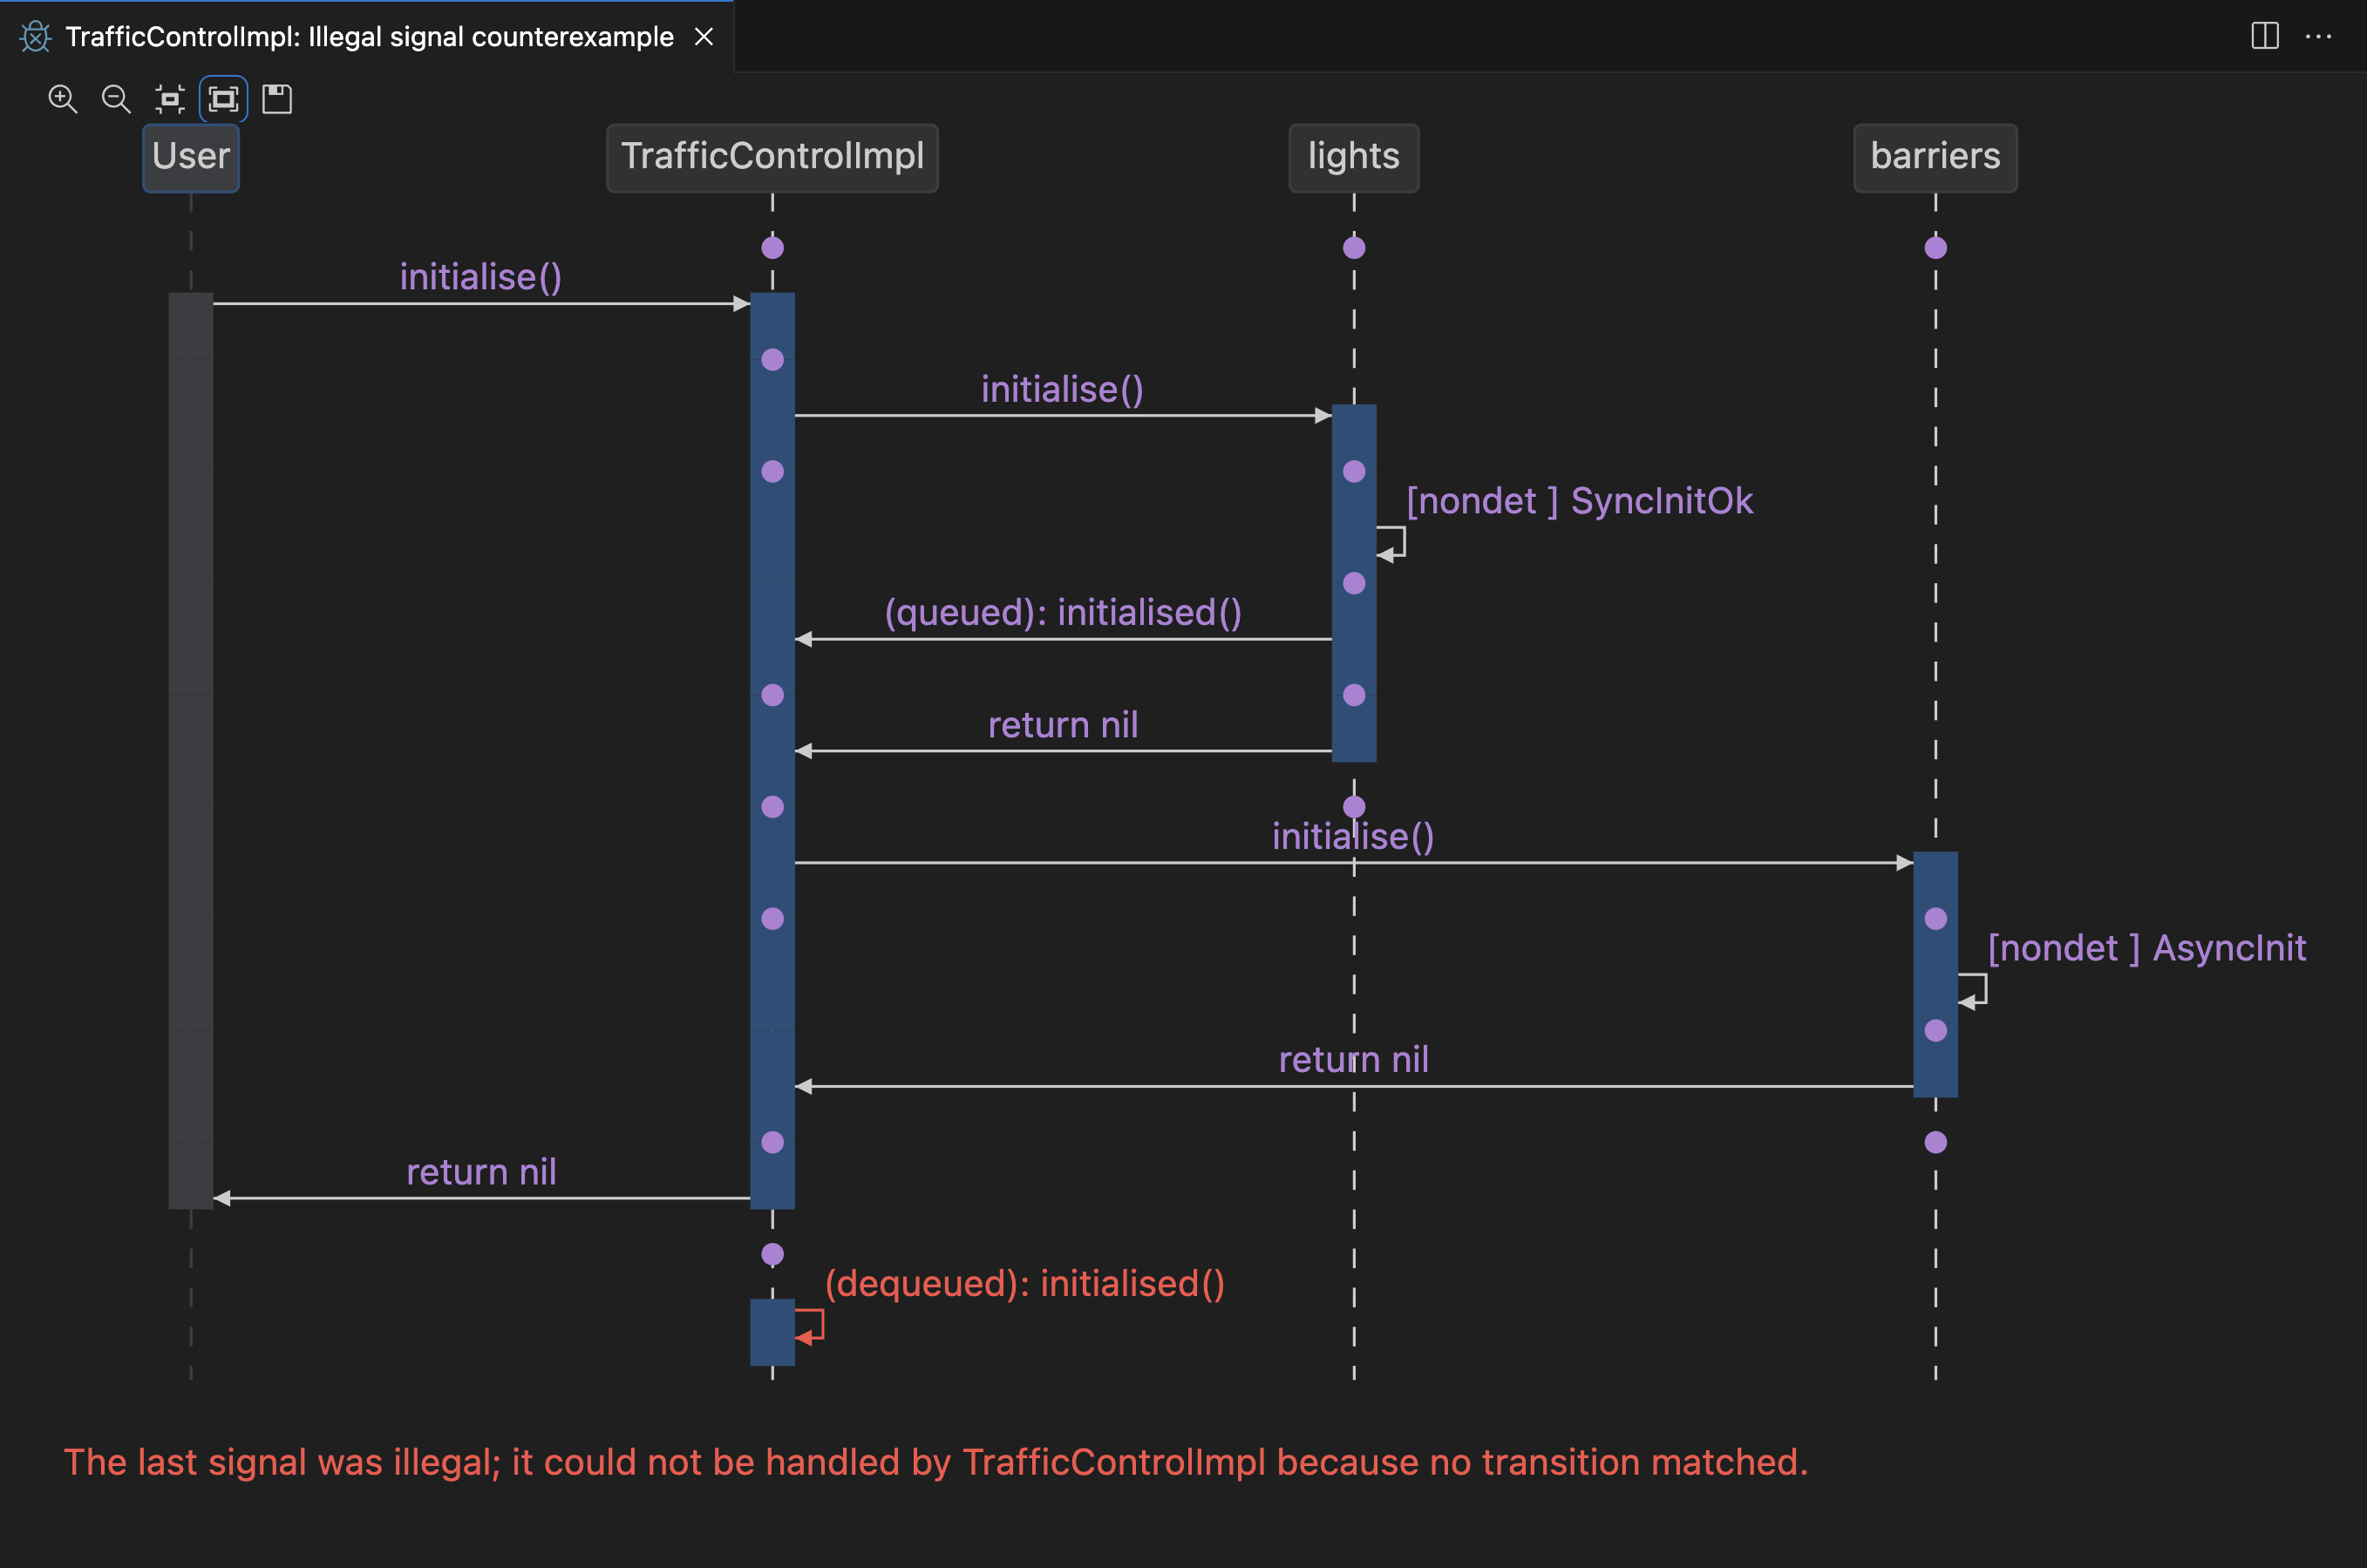
With the exception of the reachability assertions, the Counterexamples view displays a sequence
diagram, describing (one of) the shortest
sequences of interactions that led to the assertion being violated. The sequence diagram consists of swim lanes, one for
each component or port involved in the counterexample, and some additional ones which vary depending on the type of
assertion that failed. For example, in the counterexample presented above, there is a swim lane for the component
TrafficControlImpl, the required port instances lights and barriers, and then an additional one labelled User,
which represents an external user invoking all possible calls allowed by the component. For further details on what
properties are verified, together with examples of how the different types of verification errors are presented, see
Coco Language Reference.
To view more debugging information, click on VS Code’s Run and Debug () icon in the left column, where you will find additional debugging information, such as stack traces for all of the relevant components and ports, variable assignments, queue contents, and subscription status.
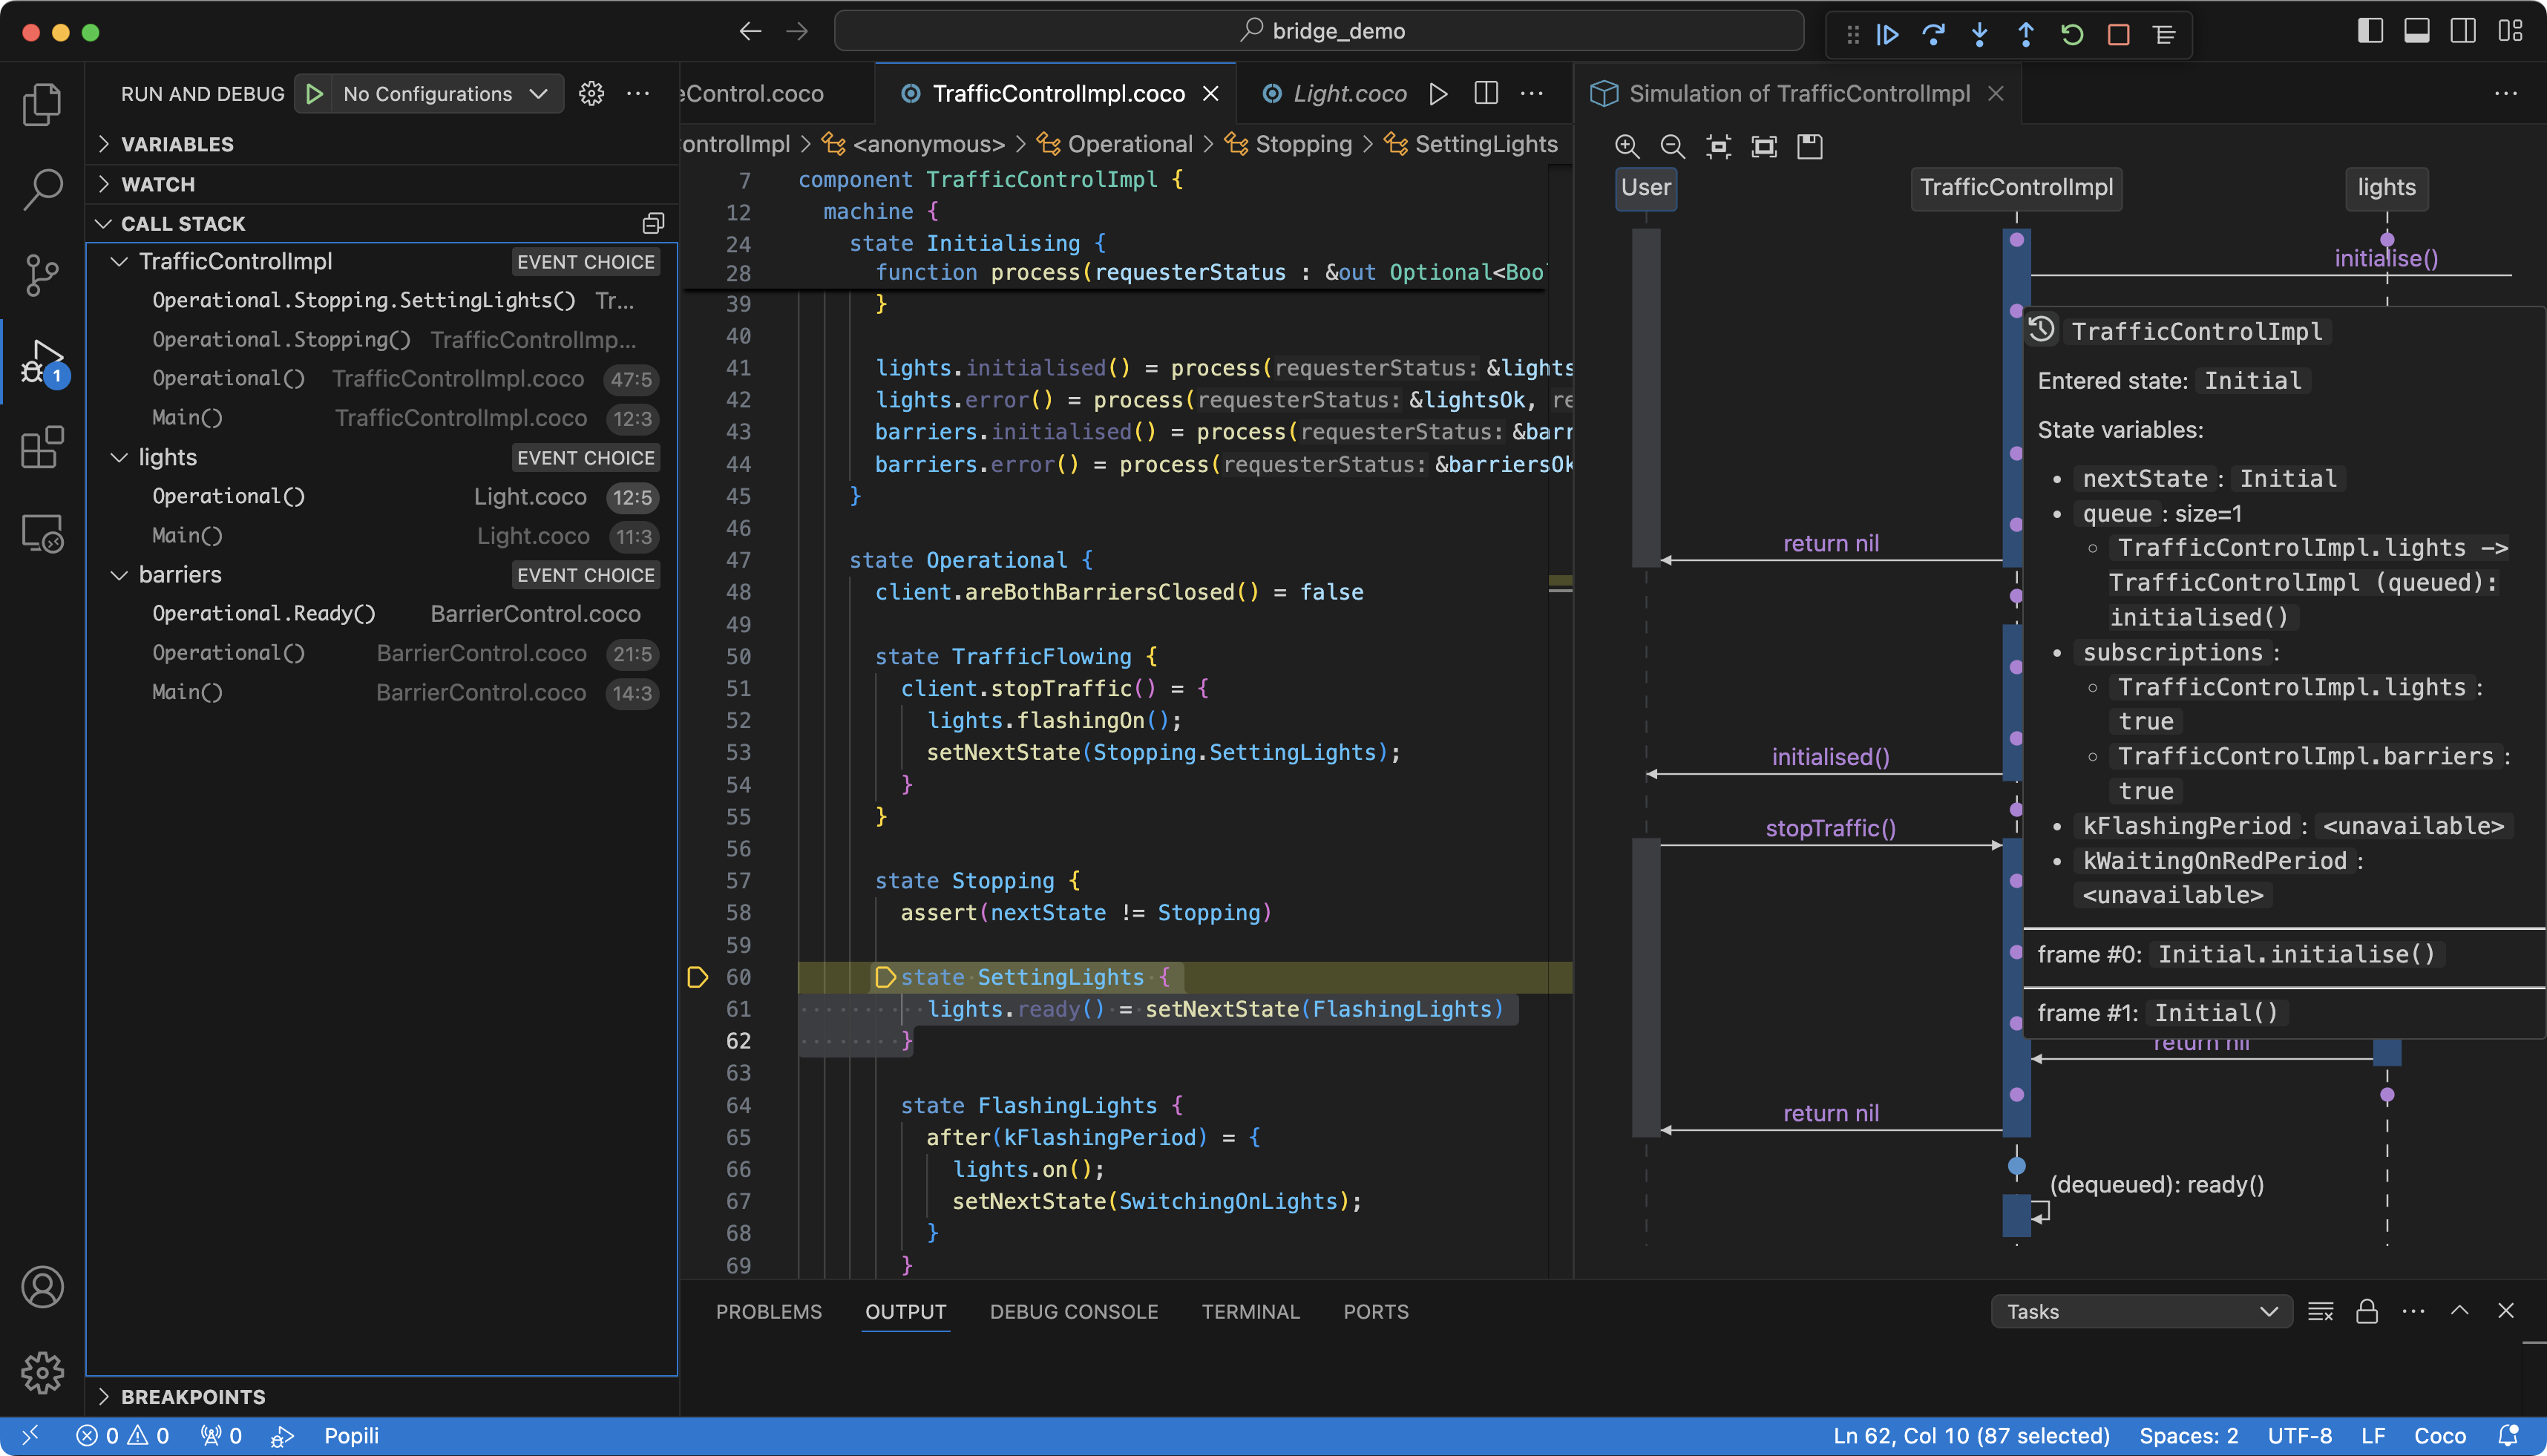
The debugger views are interactively linked to one another, as well as to the corresponding Coco module in the Coco Editor view. This means that you can explore different states in the counterexample either by clicking on any of the states in the sequence diagram, or by selecting states in the stack traces. This will highlight the corresponding code in the Coco Editor view, and show what values are assigned to the variables, along with other information such as the queue contents for your selected state:
The Counterexamples view also has a toolbar at the top, and provides the options for zoom in, zoom out, restore to its original size, zoom to fit the window, and save the sequence diagram to a file.
By default, the counterexamples are updated automatically when the code is changed, as summarised in Live Updates.
Reachability Counterexamples
For reachability warnings, Popili provides multiple views for displaying the results. To launch the debugger to view the reachability counterexamples, click on the View Reachability Results button (), which appears when hovering over an assertion that has a reachability warning. This will launch a summary of results in the Counterexamples view, which includes a graphical representation of the reachability results displayed within the corresponding state machine diagram. In addition, the code for the port or component declaration being verified is also highlighted to reflect the reachability information inline. The following simple example illustrates these views:
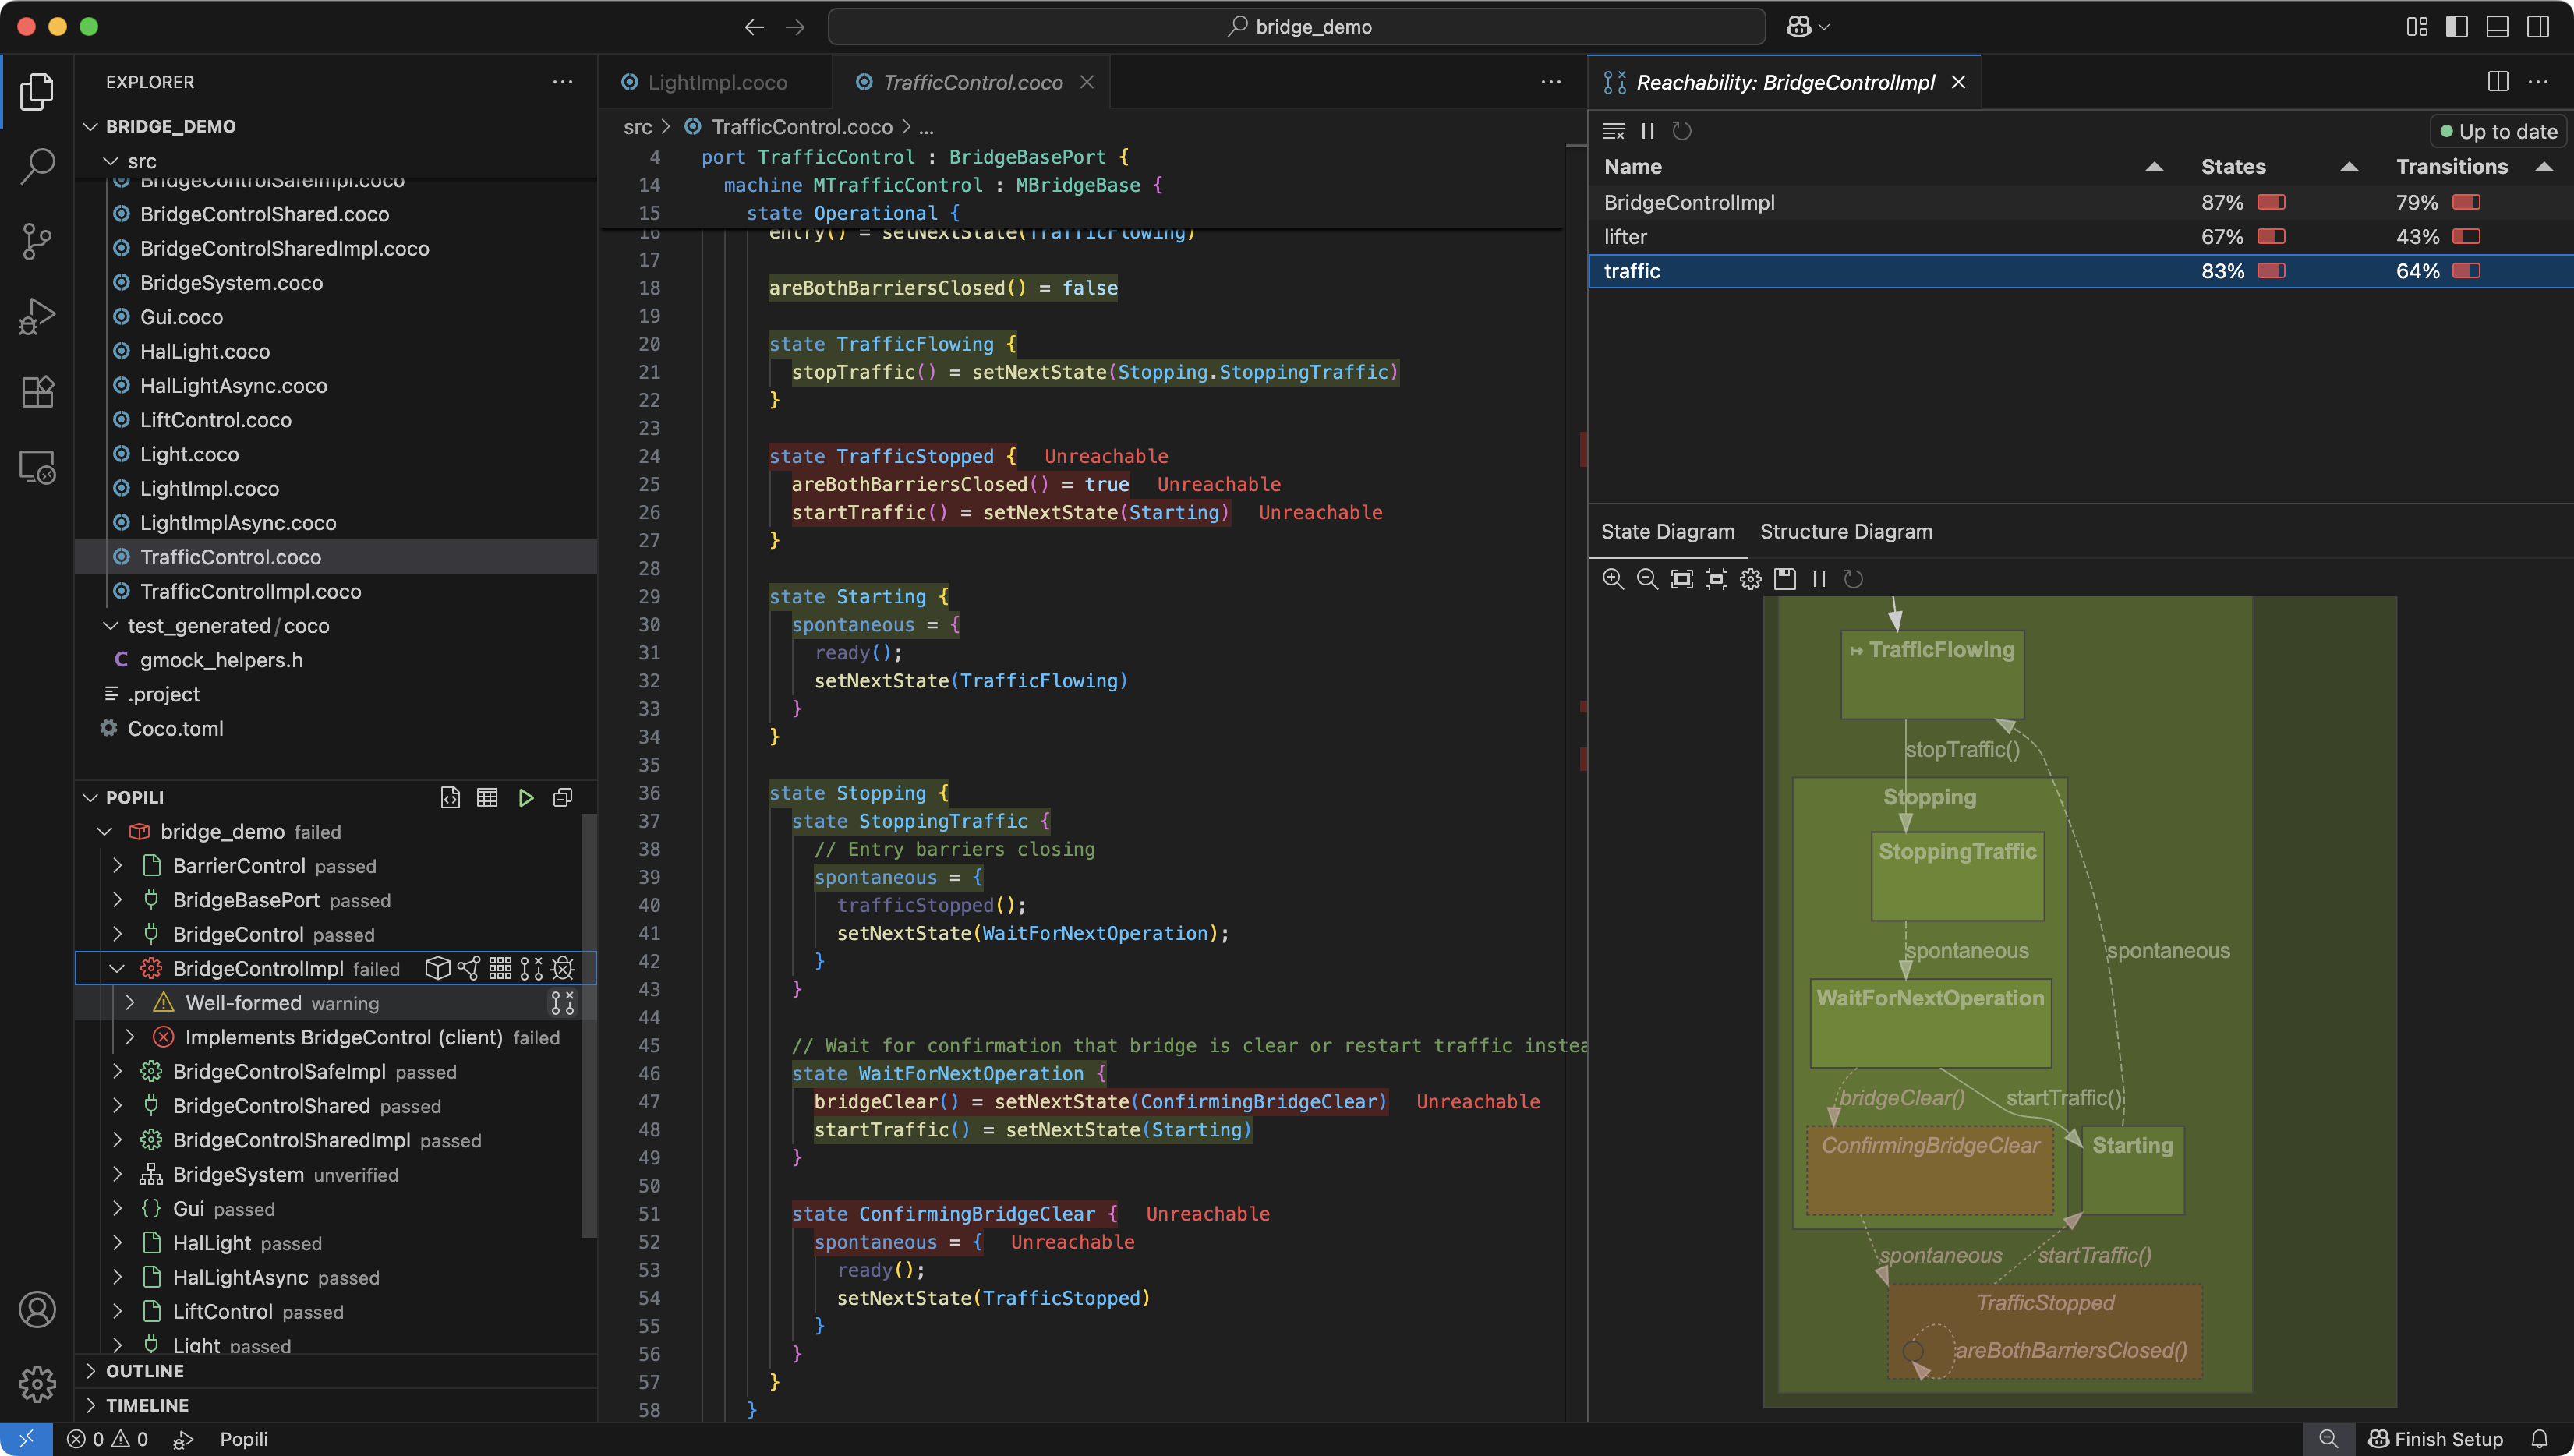
In this example of the reachability results for the TrafficControl port, the states TrafficStopped and ConfirmingBridgeClear,
together with their respective transition declarations, are unreachable. Further, the transition for the function
bridgeClear() in the state WaitForNextOperation is also unreachable.
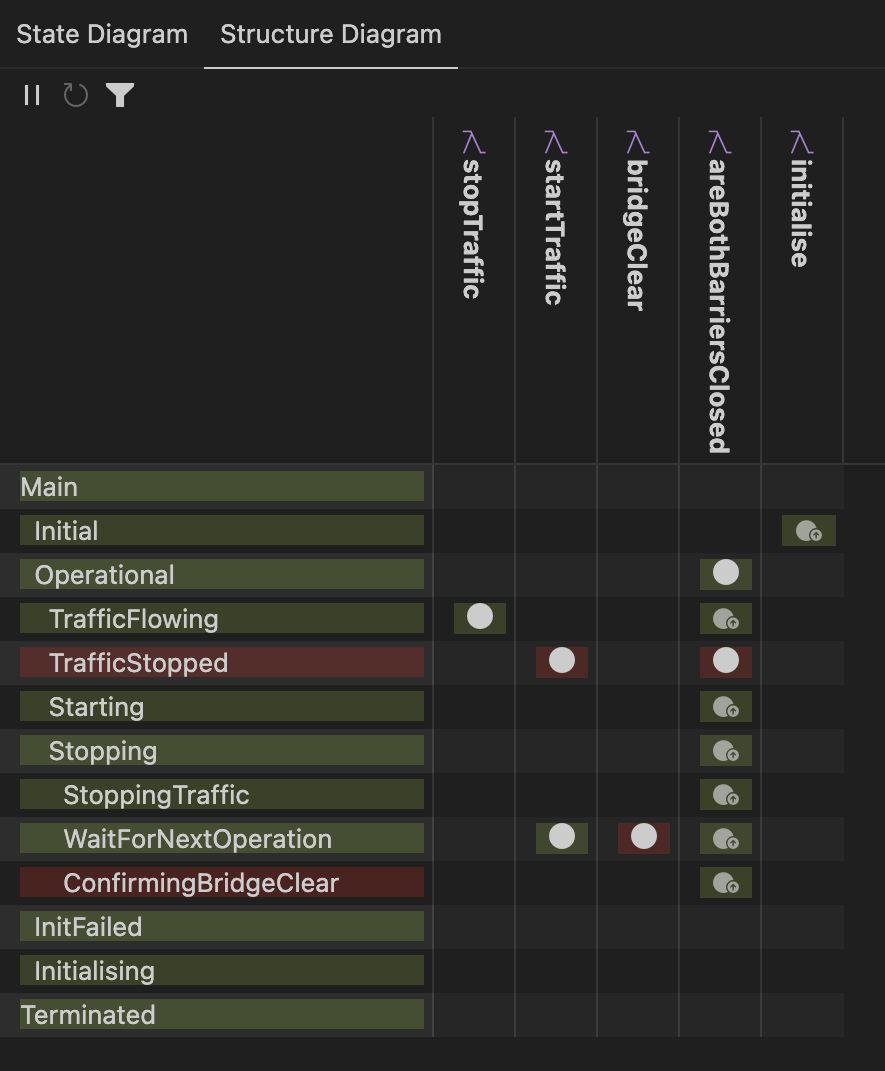
The reachability results can also be displayed in a tabular form following the structure viewer format by selecting the Structure Diagram tab:
Simulate Counterexamples
A counterexample can also be reopened in the simulator allowing you to explore alternative scenarios. To do this, hover over the swim lane label of a port or component in your counterexample, and click on that appears next to it:
This will launch the Simulator view with the counterexample loaded:
You can then use the Simulator for Coco in the normal way, for example by rolling back the simulation to an earlier state, and exploring alternative paths to help understand and debug the error.
Remote Verification
Depending on your Popili Preferences settings, and the availability of the remote verification service, the verification will be run locally or remotely.
The setting options are as follows:
- disabled means that only the local backend will be used.
- enabled means that the backend is enabled with the default policy. This is currently equivalent to onlyIfAvailable.
- only means that only the remote backend will be used.
- onlyIfAvailable means that only the remote backend will be used, providing it is available.
There are two main advantages of running the verification remotely. Firstly, the verification is CPU and memory intensive, and therefore large projects will be faster to verify using the remote verification due to the additional resources available. Secondly, the verification results are cached, and shared between all of members in your team who are working on the same project. This avoids rerunning the verification unnecessarily on projects that have already been verified. All changes made to any of the verification results, for example due to a change made by a team member to one of the Coco modules in the project, will be available to everyone else who has access to that project, and is also running the verification remotely.
Simulator for Coco
Popili’s simulator allows Coco port and component state machines to be interactively explored, where you can choose which event should be performed at each step. Further, you can also launch the simulator with a counterexample (generated by the verification), and explore alternative scenarios based on the counterexample.
There are several ways to launch the simulator:
- Hover over a port or component in the Assertions view and click on that appears next to it.
- Click on Simulate, which appears as a code lens immediately above state machines in a Coco module.
- Open the Command Palette and search for Popili:Launch Simulation.
- Launch the simulator with a counterexample by hovering over a swim lane label of a port or component in your counterexample, and click on that appears next to it.
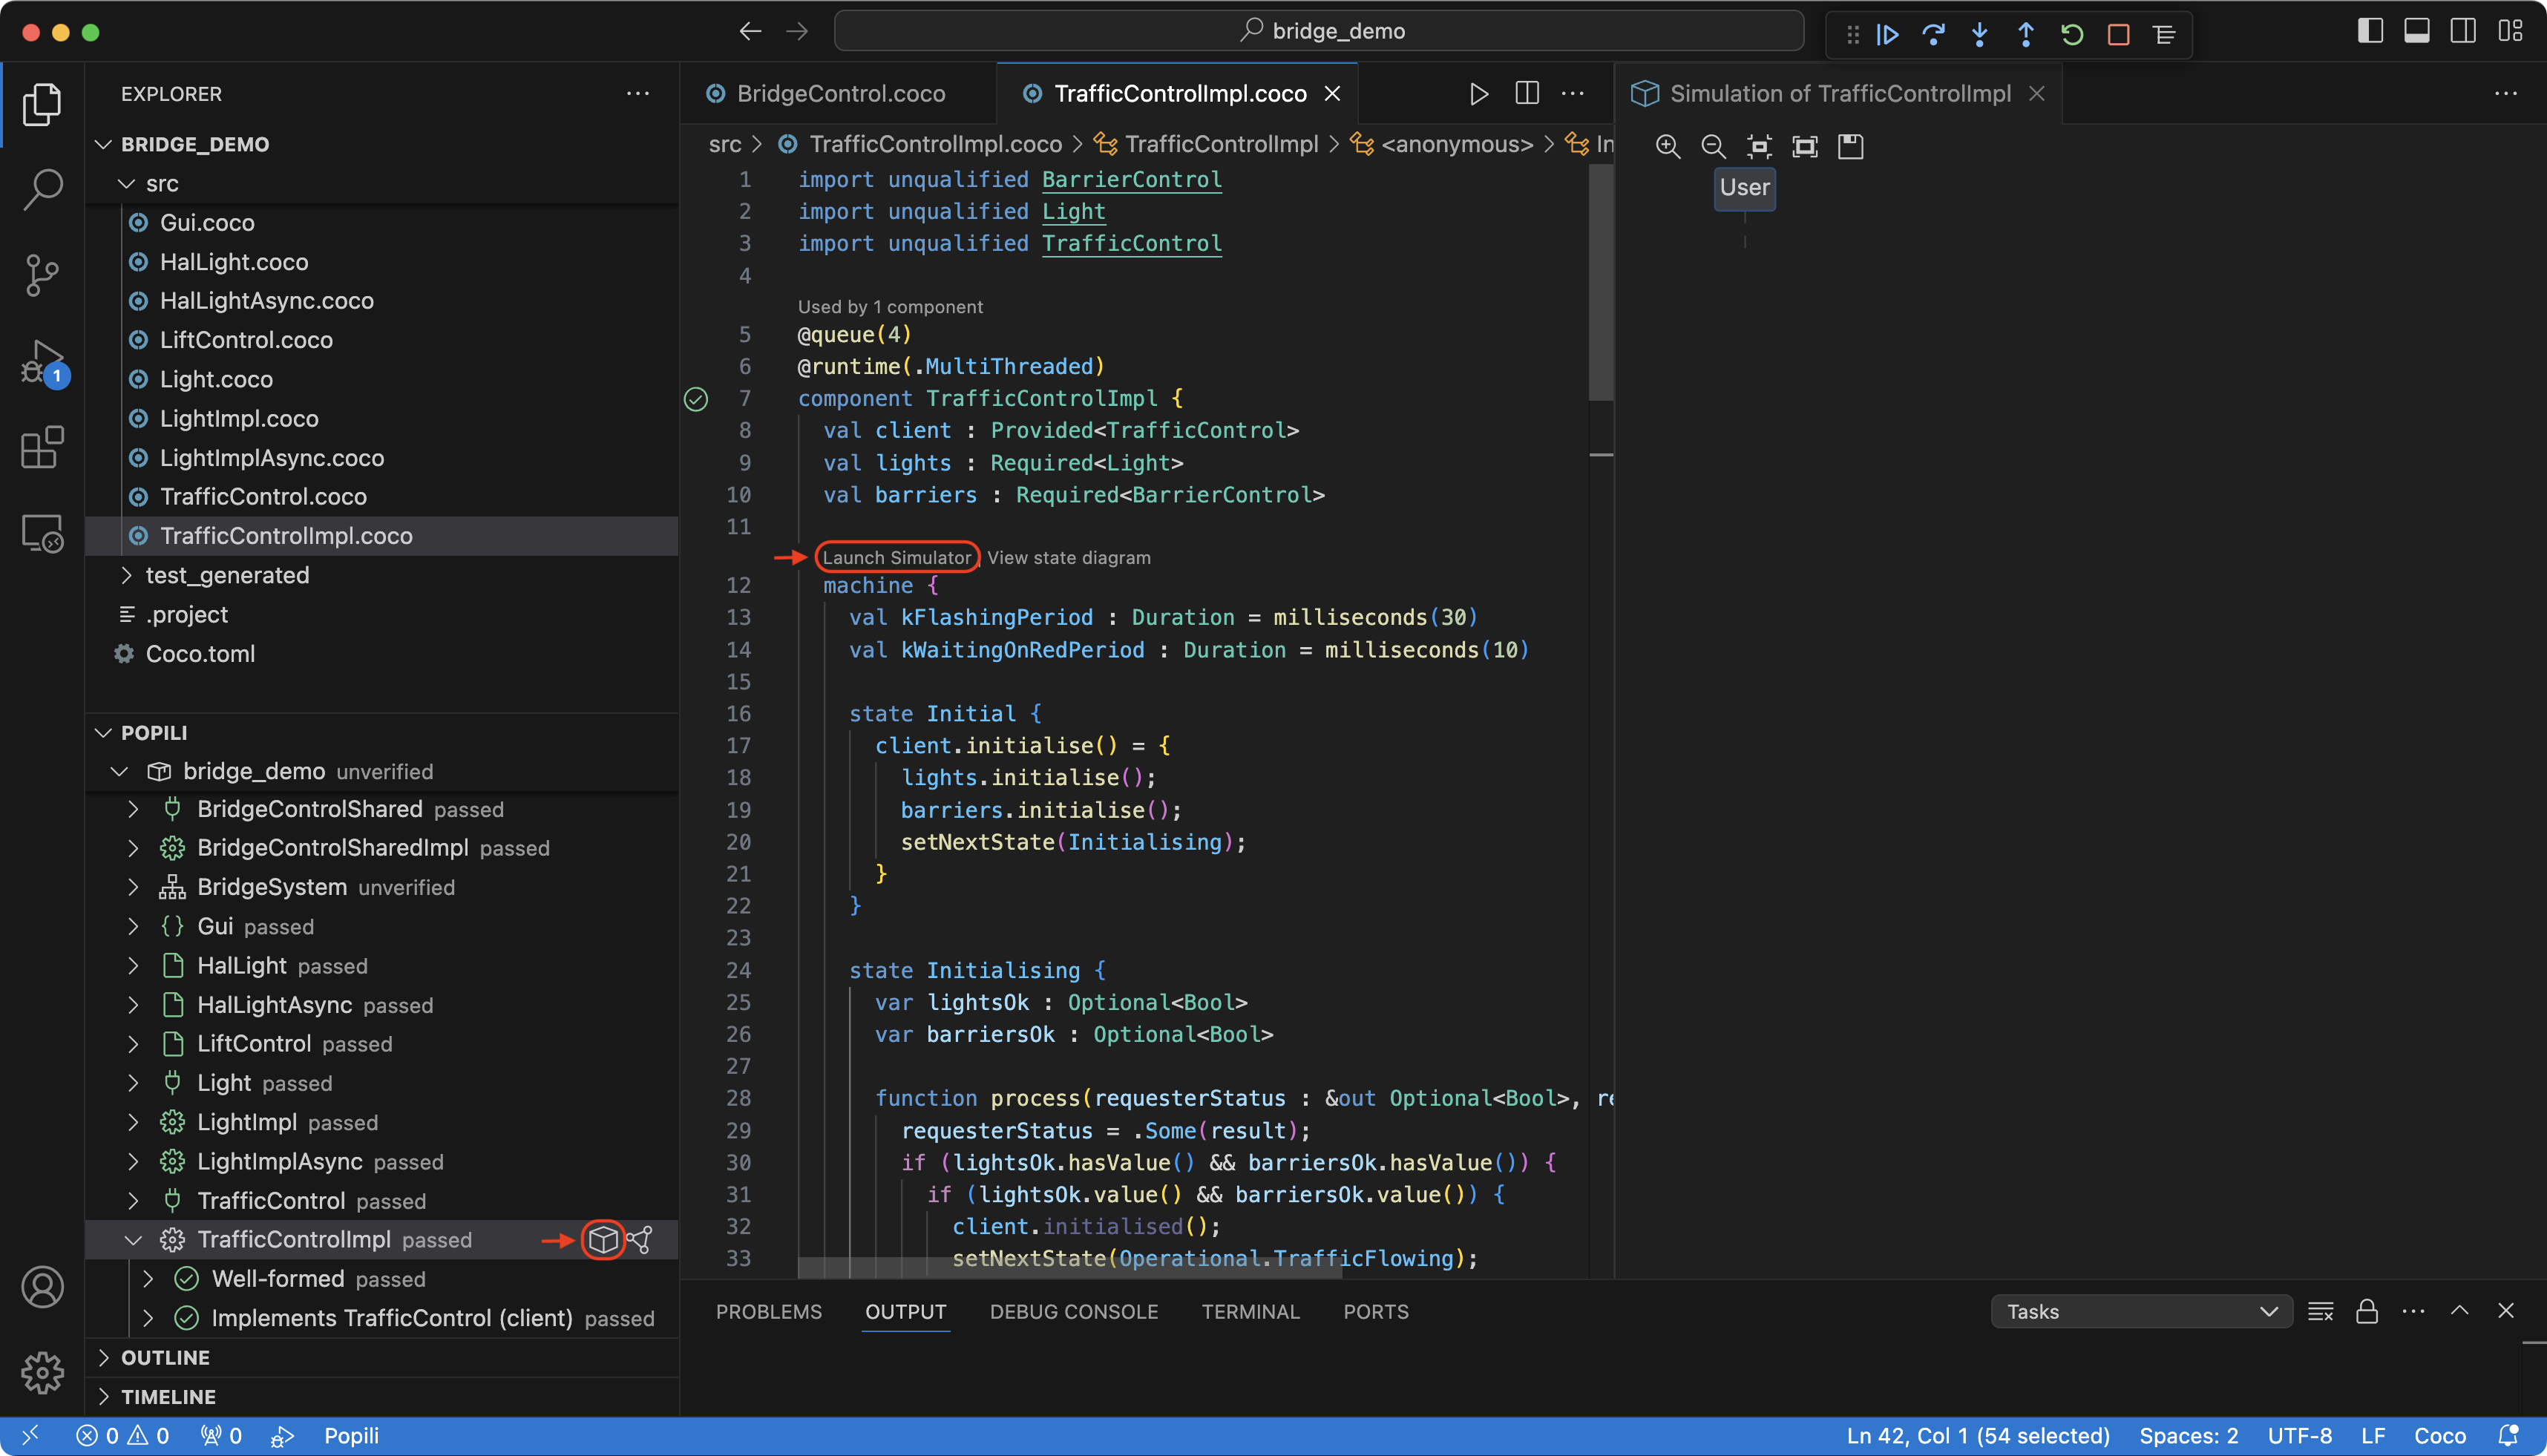
As illustrated above, the Simulator view is launched on the right-hand side as a tabbed header of the state machine being simulated. This includes a toolbar with the following five buttons: zoom in, zoom out, restore to its original size, zoom to fit the window, and save the sequence diagram to a file.
In addition, the Simulator view has another floating toolbar for driving the simulator with the following buttons:
| Icon | Name | Meaning |
|---|---|---|
| Continue | Advances execution until the next externally visible event, for example a spontaneous transition or a call to a transition function on one of the components or ports. | |
| Step Over | Advances execution at a coarser statement/line level of granularity, in particular stepping past any functions invoked. | |
| Step Into | Advances execution at the lowest instruction level of granularity, in particular stepping into any functions invoked. | |
| Step Out | Advances until the current function/stack frame returns. | |
| Restart | Restarts the simulation again. | |
| Stop | Terminates the current simulation. | |
| Select Event | Displays the list of events that can occur in the current state in the Command Palette. |
The first four buttons listed above are collectively referred to as the step buttons. Note that for Step Into and Step Over, the granularity does not always map exactly to the familiar instruction and line level step functions of a conventional debugger due to the restrictions in the underlying computation model of the simulation.
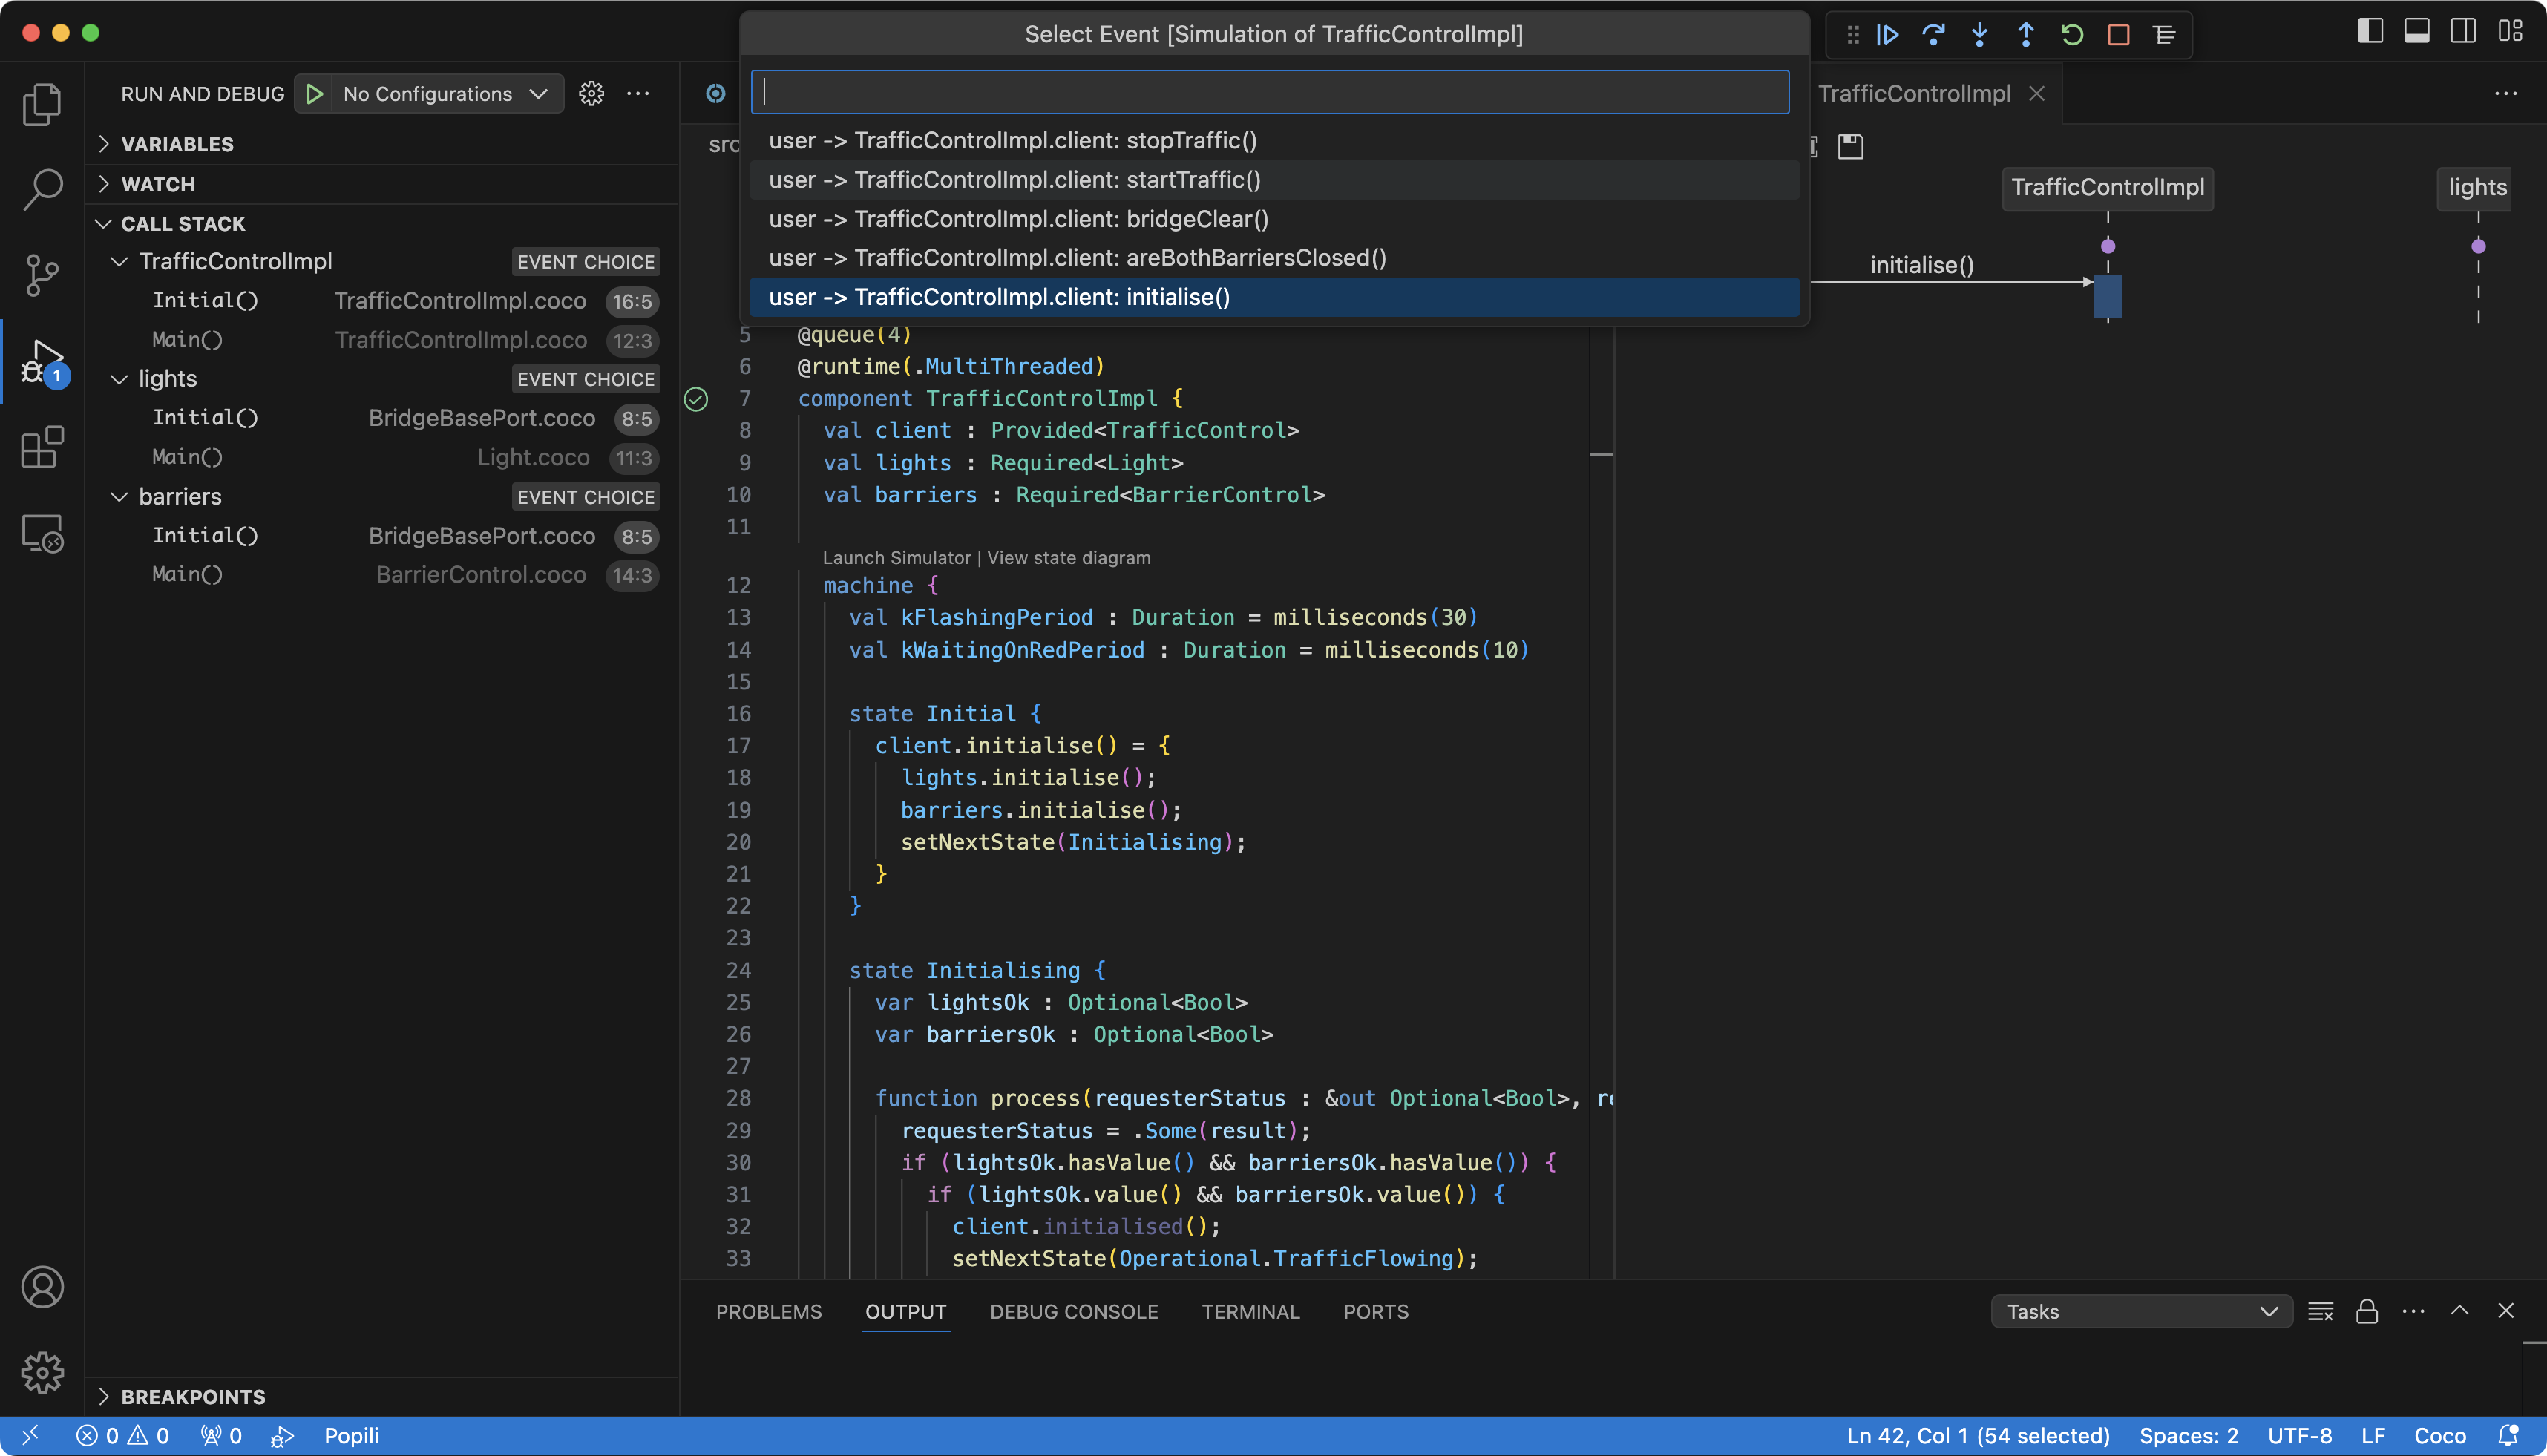
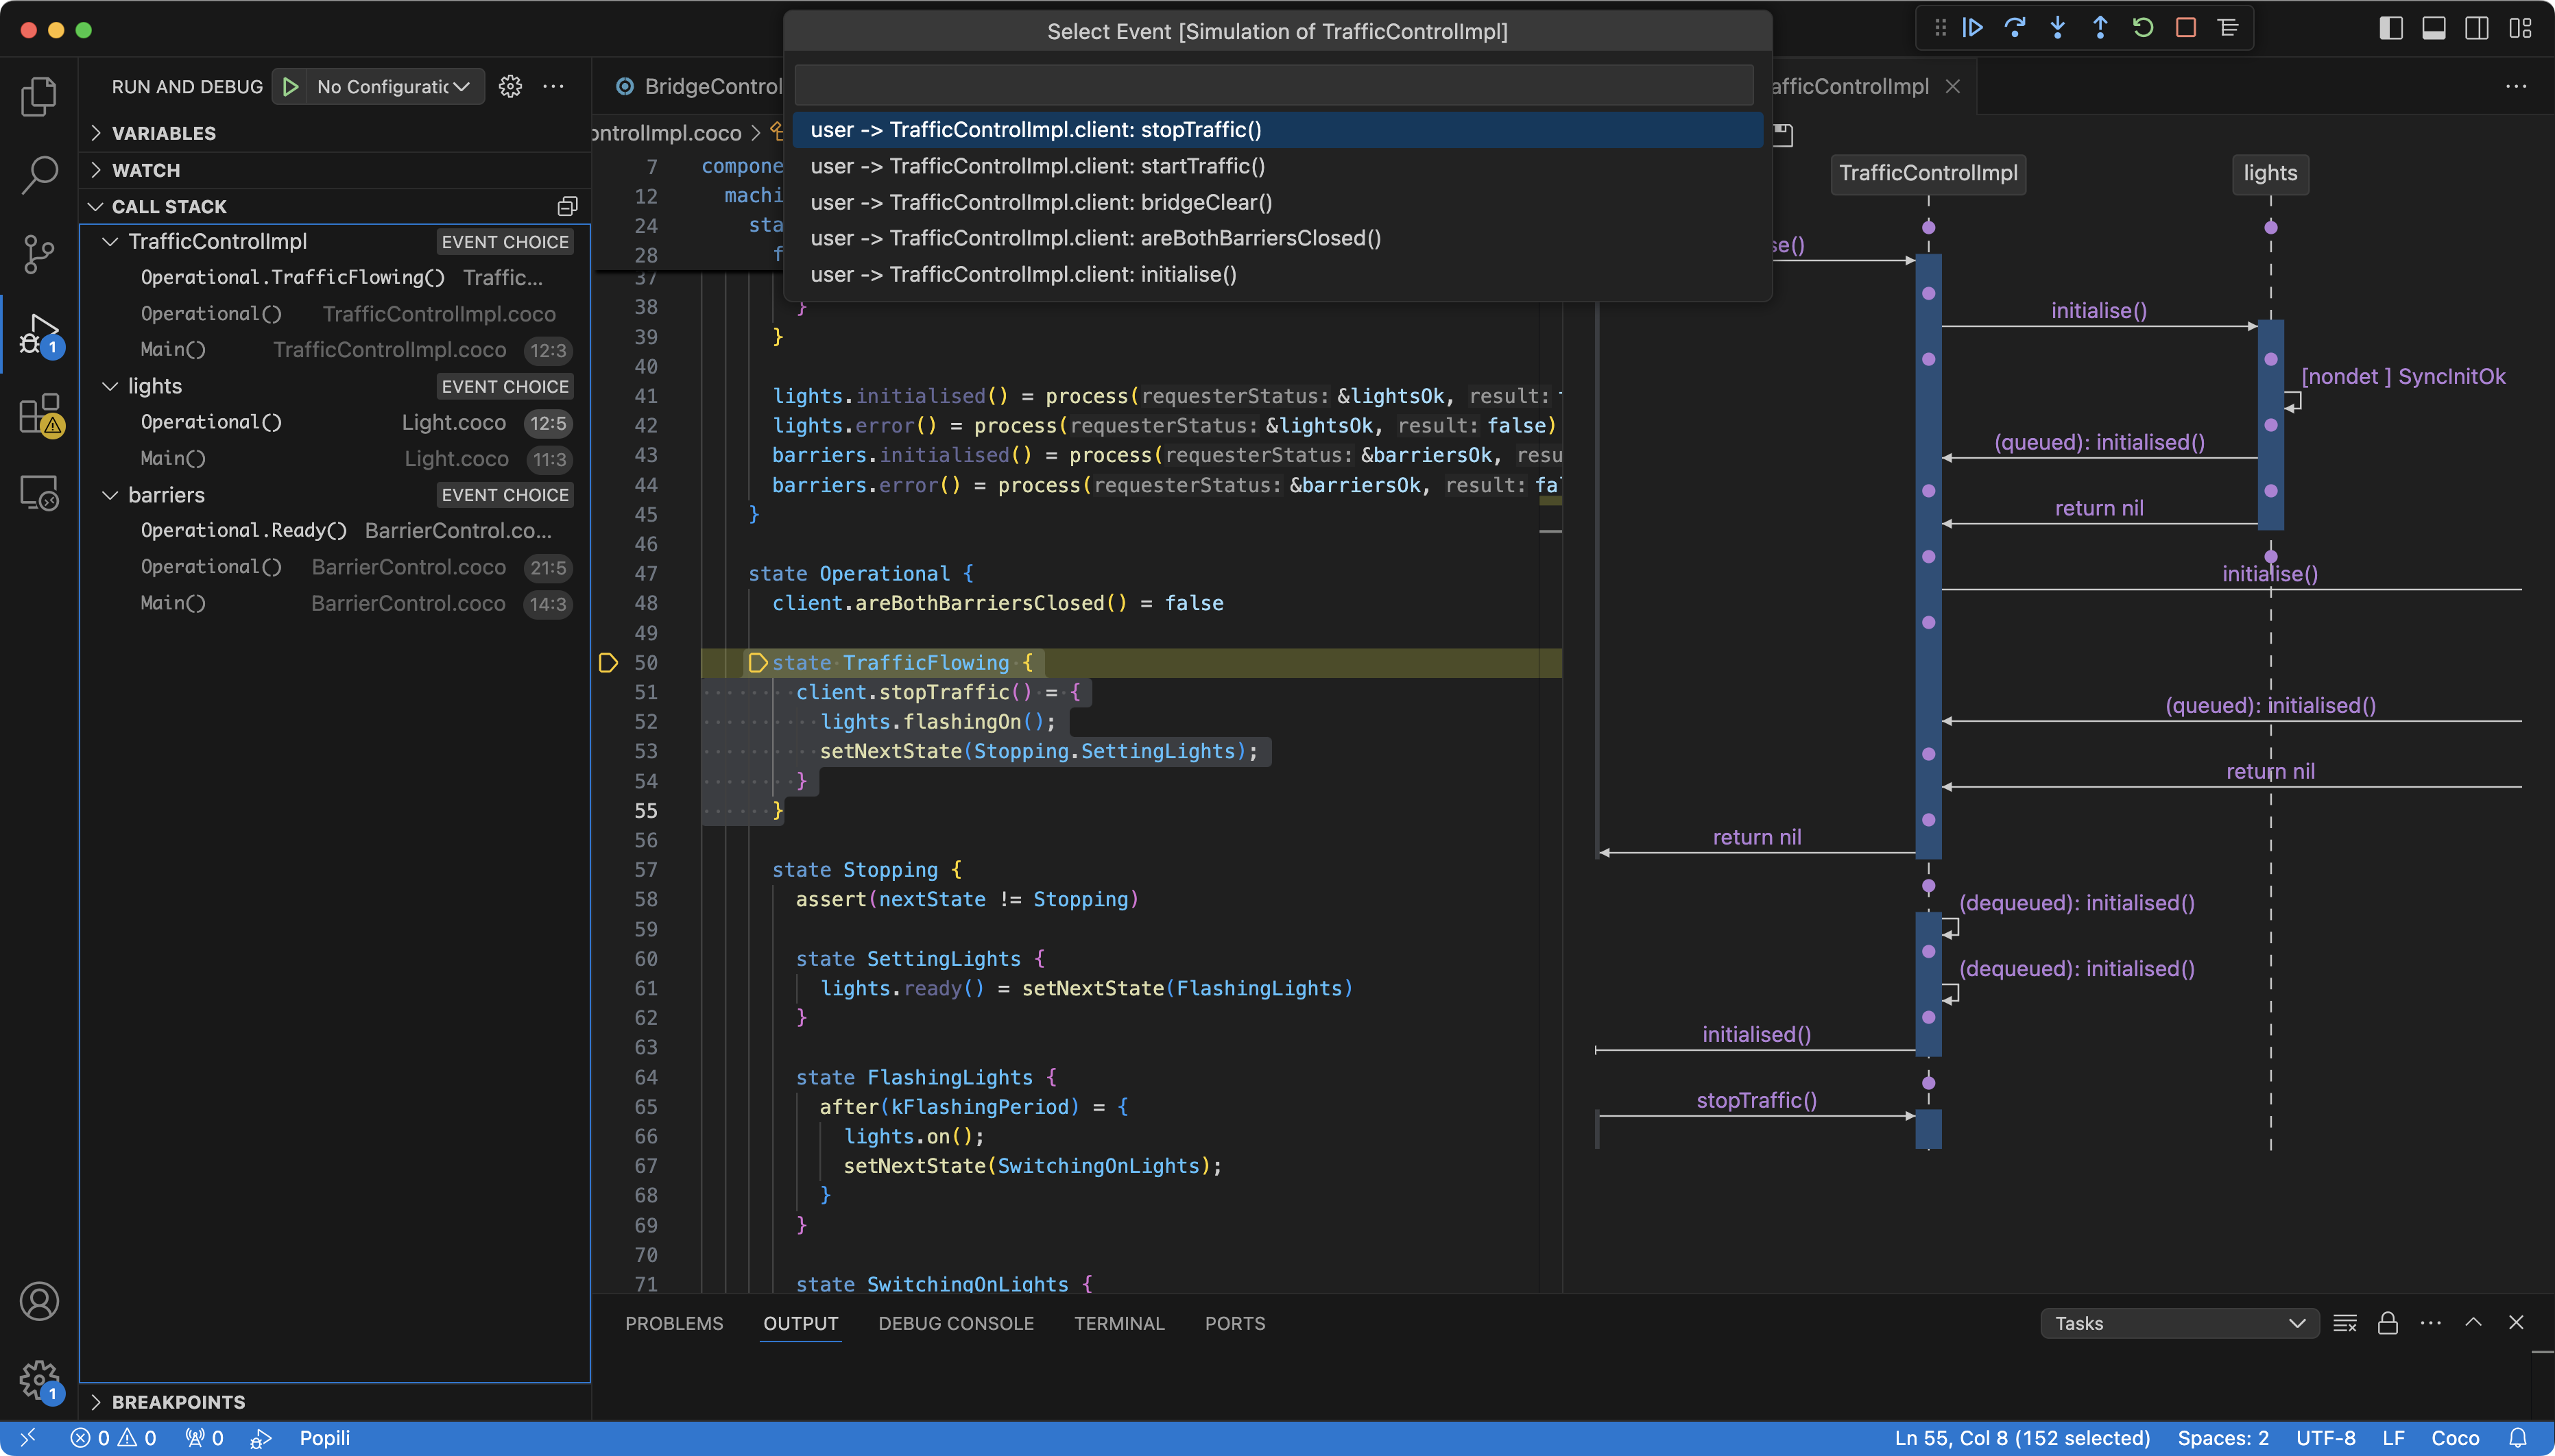
To get started, click on one of the step buttons (for example, ), which will cause the event selector popup menu to appear in the top prompt listing the possible events you can select. If more than one choice is displayed, then these reflect different possible interleavings of events. Clicking esc will hide the list of events, and clicking causes it to reappear. By default, the simulation will select the first event in the list, but you can select a different event in the list. To execute the selected event, click on one of the step buttons.
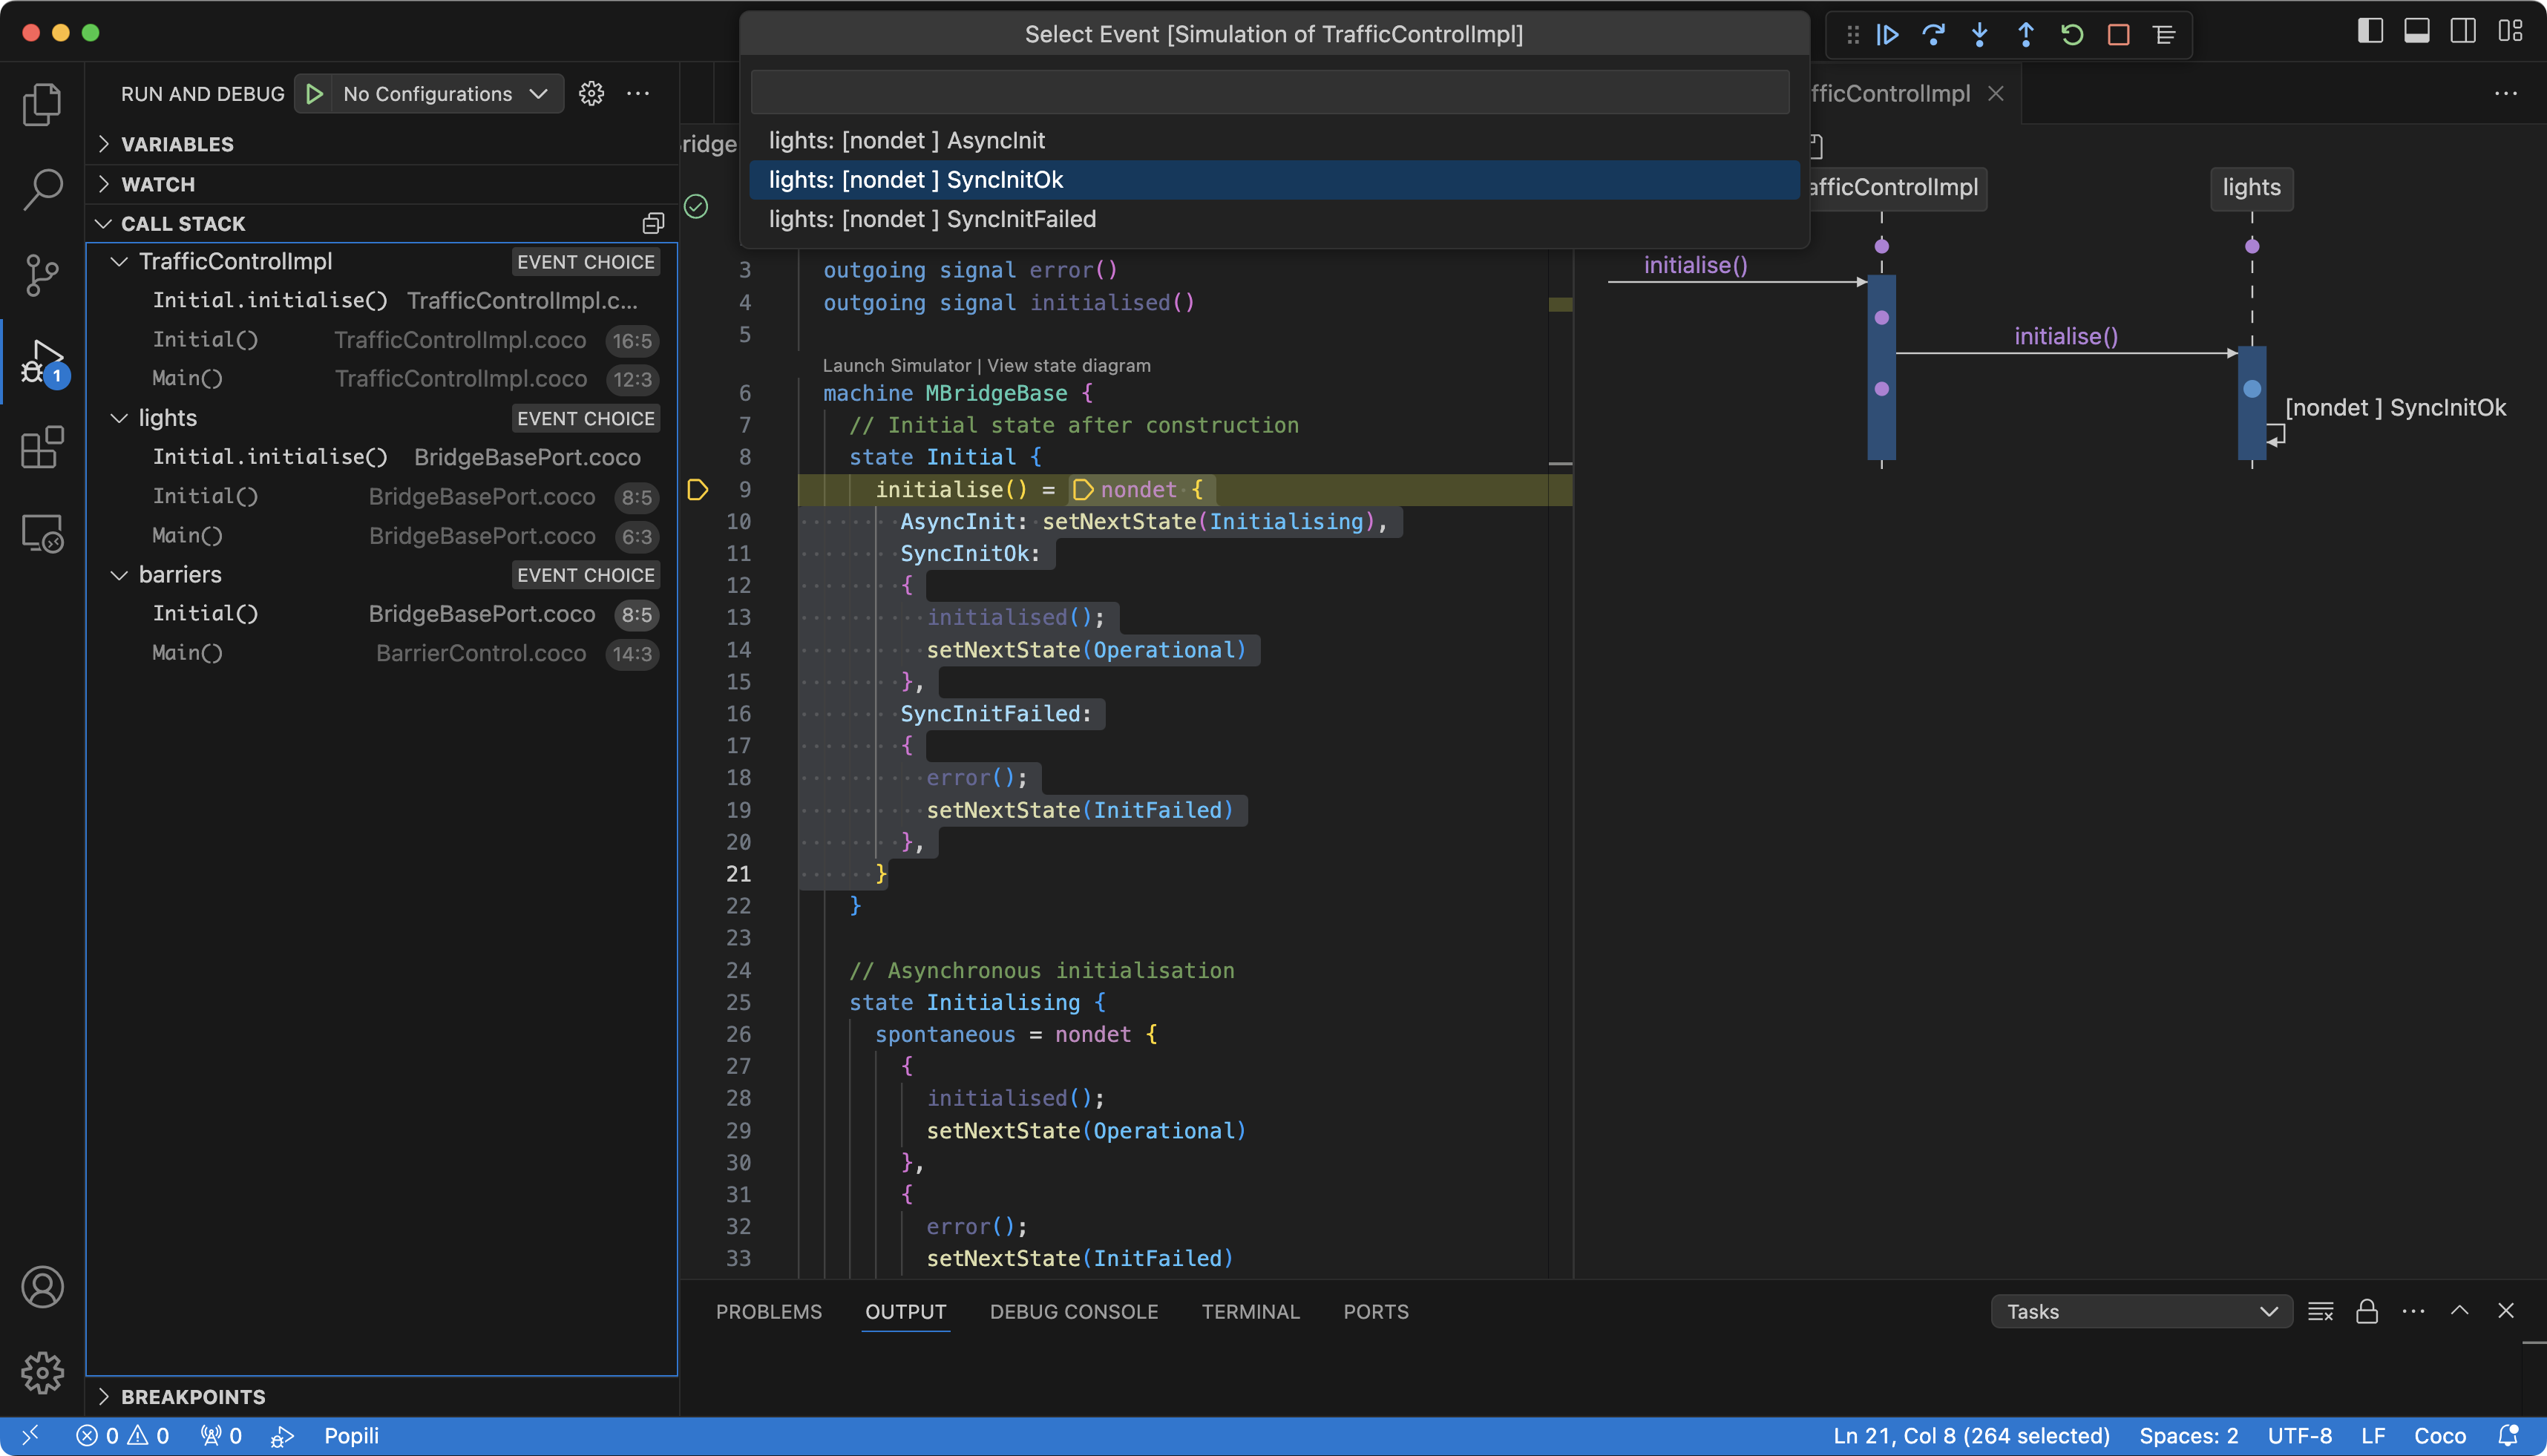
When an event is selected in the event selector list, it will appear in the sequence diagram, as illustrated below:
If there are multiple events to choose from, then as you scroll down the list, you will see the different events appear in the sequence diagram. An event is not executed until you click one of the step buttons, after which you will see the step highlighted in the corresponding state machine and in the sequence diagram:
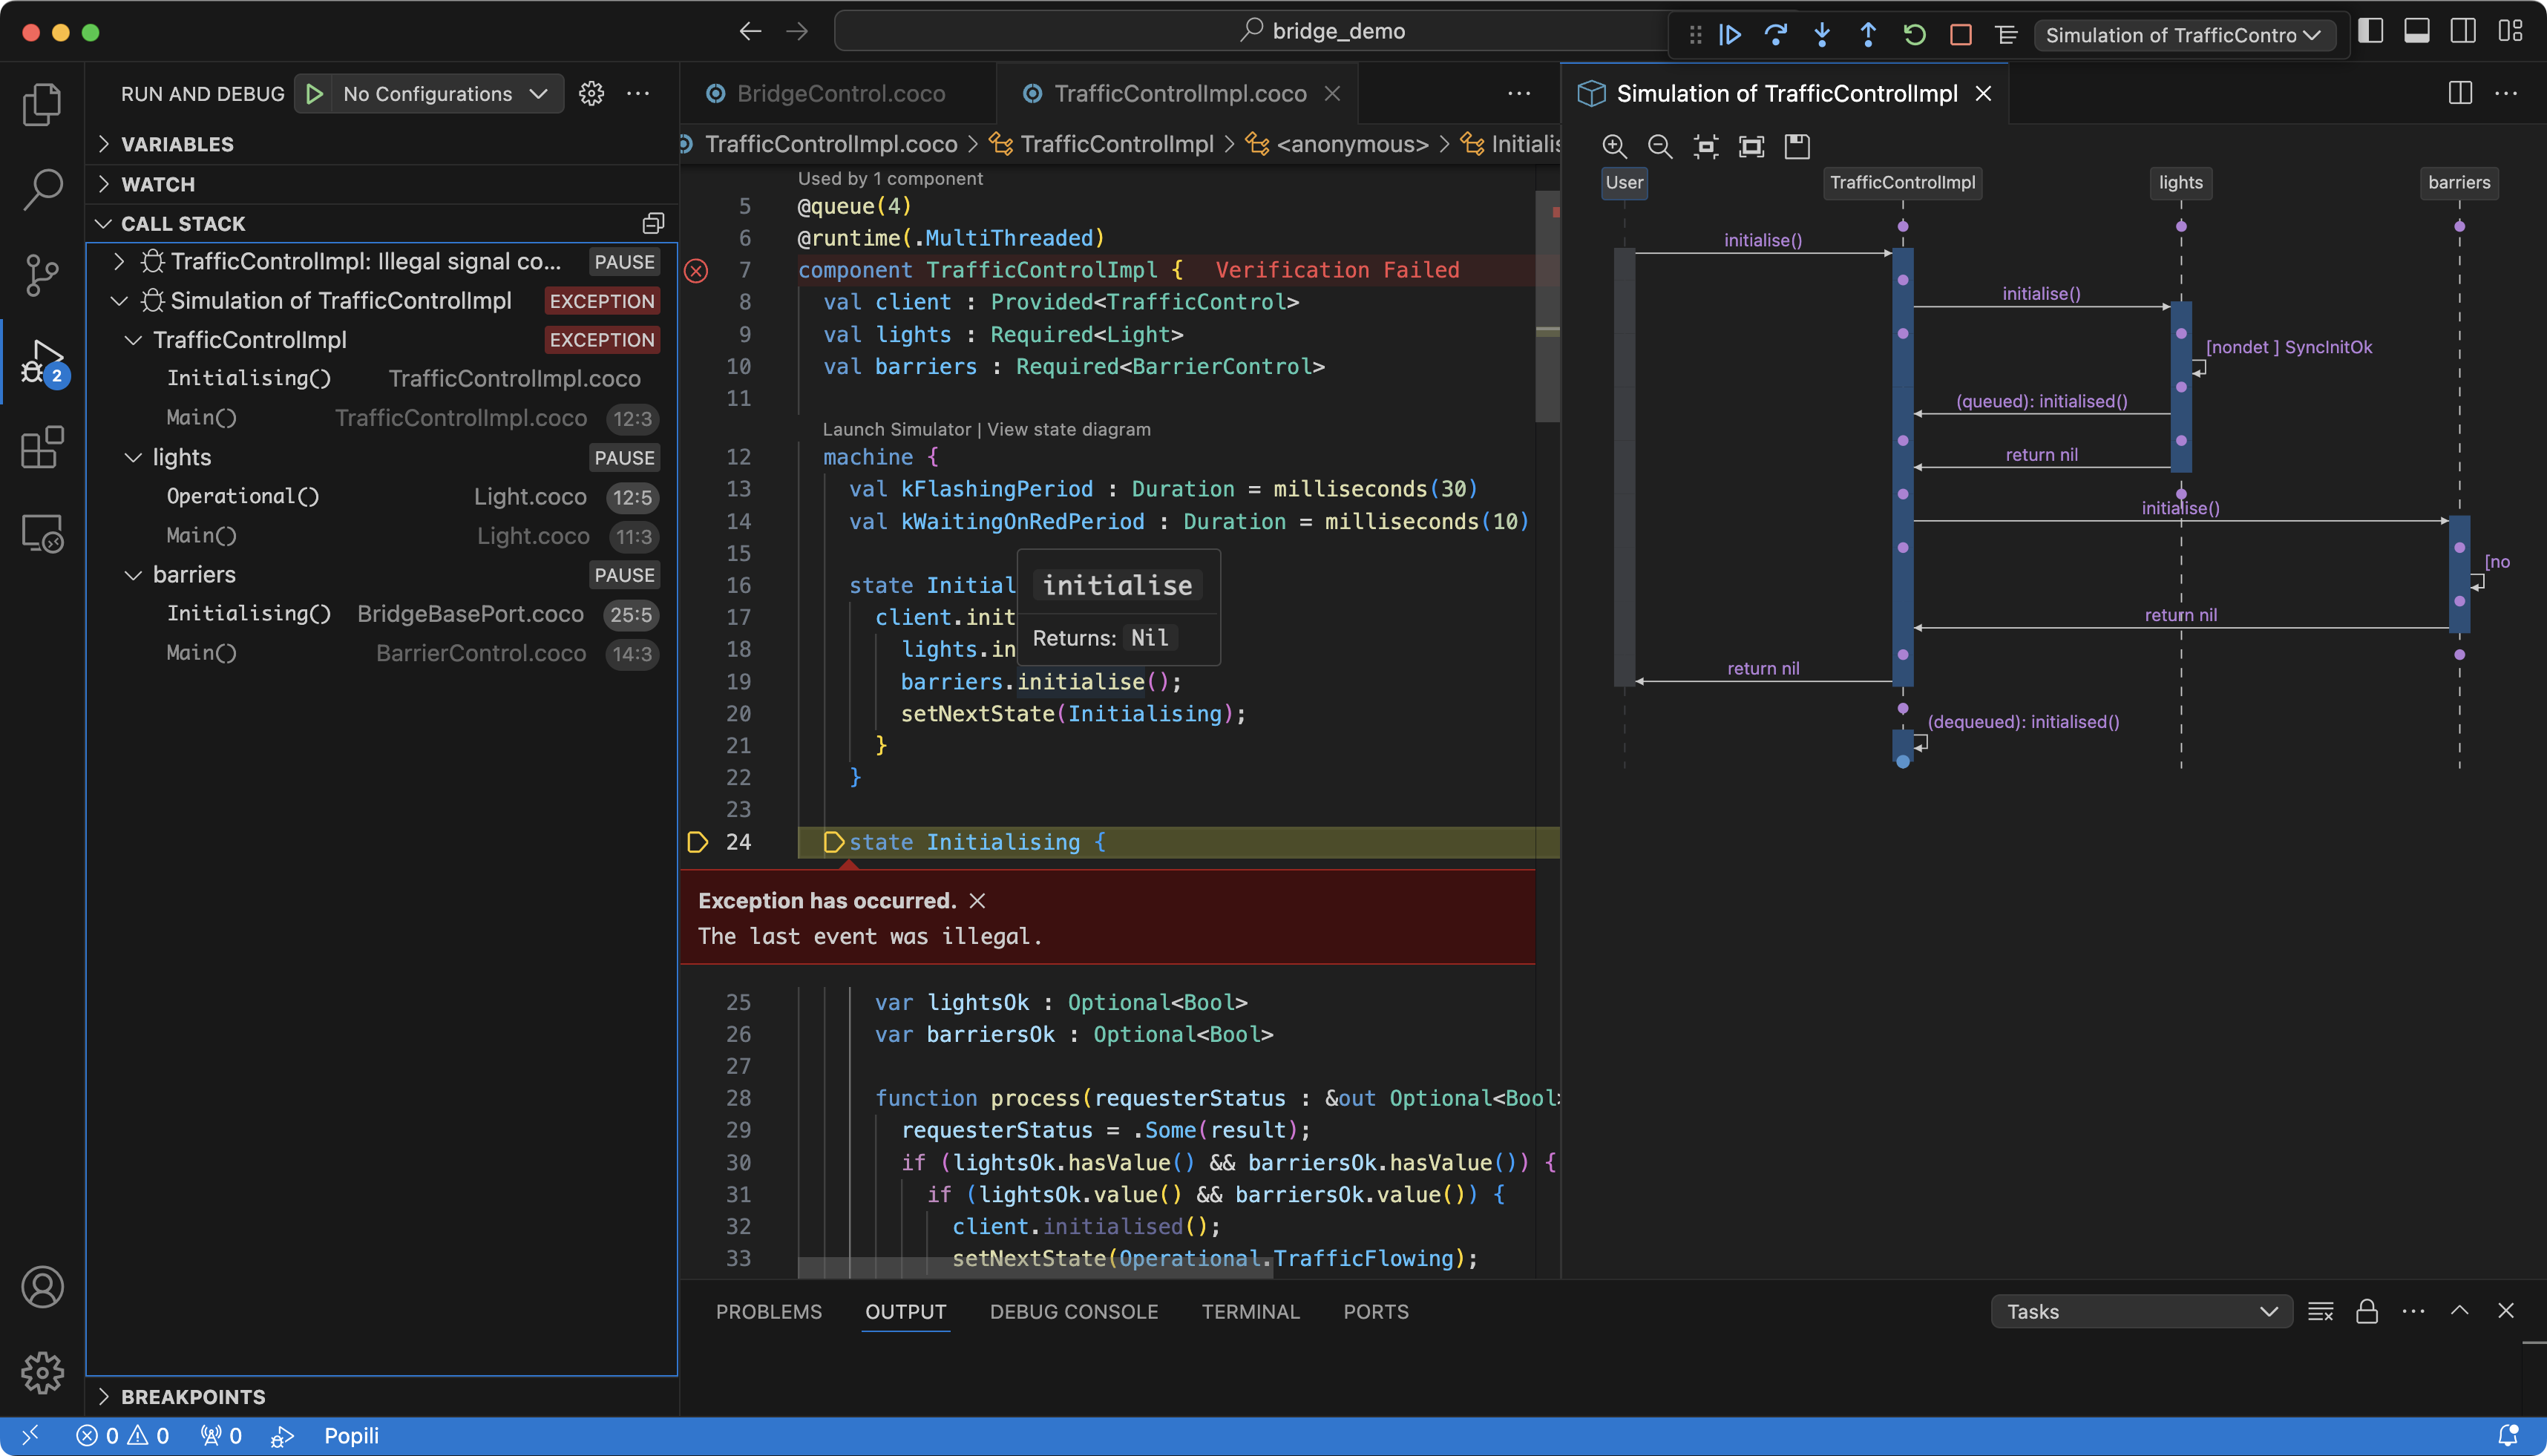
The Run and Debug view displays the same additional debugging information as displayed in the
Counterexamples view. It is also interactively linked with the Simulator view and the
Editor view containing the corresponding Coco modules, as they are in the Counterexamples view. This means
that the code corresponding to the most recent step selected in the simulator is highlighted. In the example above,
the lights port instance inherits the
initialisation behaviour it is currently executing from a base port called BridgeBasePort, which is highlighted
in the Editor view.
At any point in the simulation, you can roll back the simulation to an earlier state in your sequence diagram, and explore alternative scenarios. If you hover your curser over an earlier state in the sequence, the roll back icon will appear next to the state, as illustrated in the following example:
If you click on , then the simulator will roll back to this point in your simulation:
You can then continue stepping through different scenarios with the simulator in the normal way.
If you have multiple debug sessions enabled, then you can run multiple simulations at the same time, either of the same state machine or different ones:
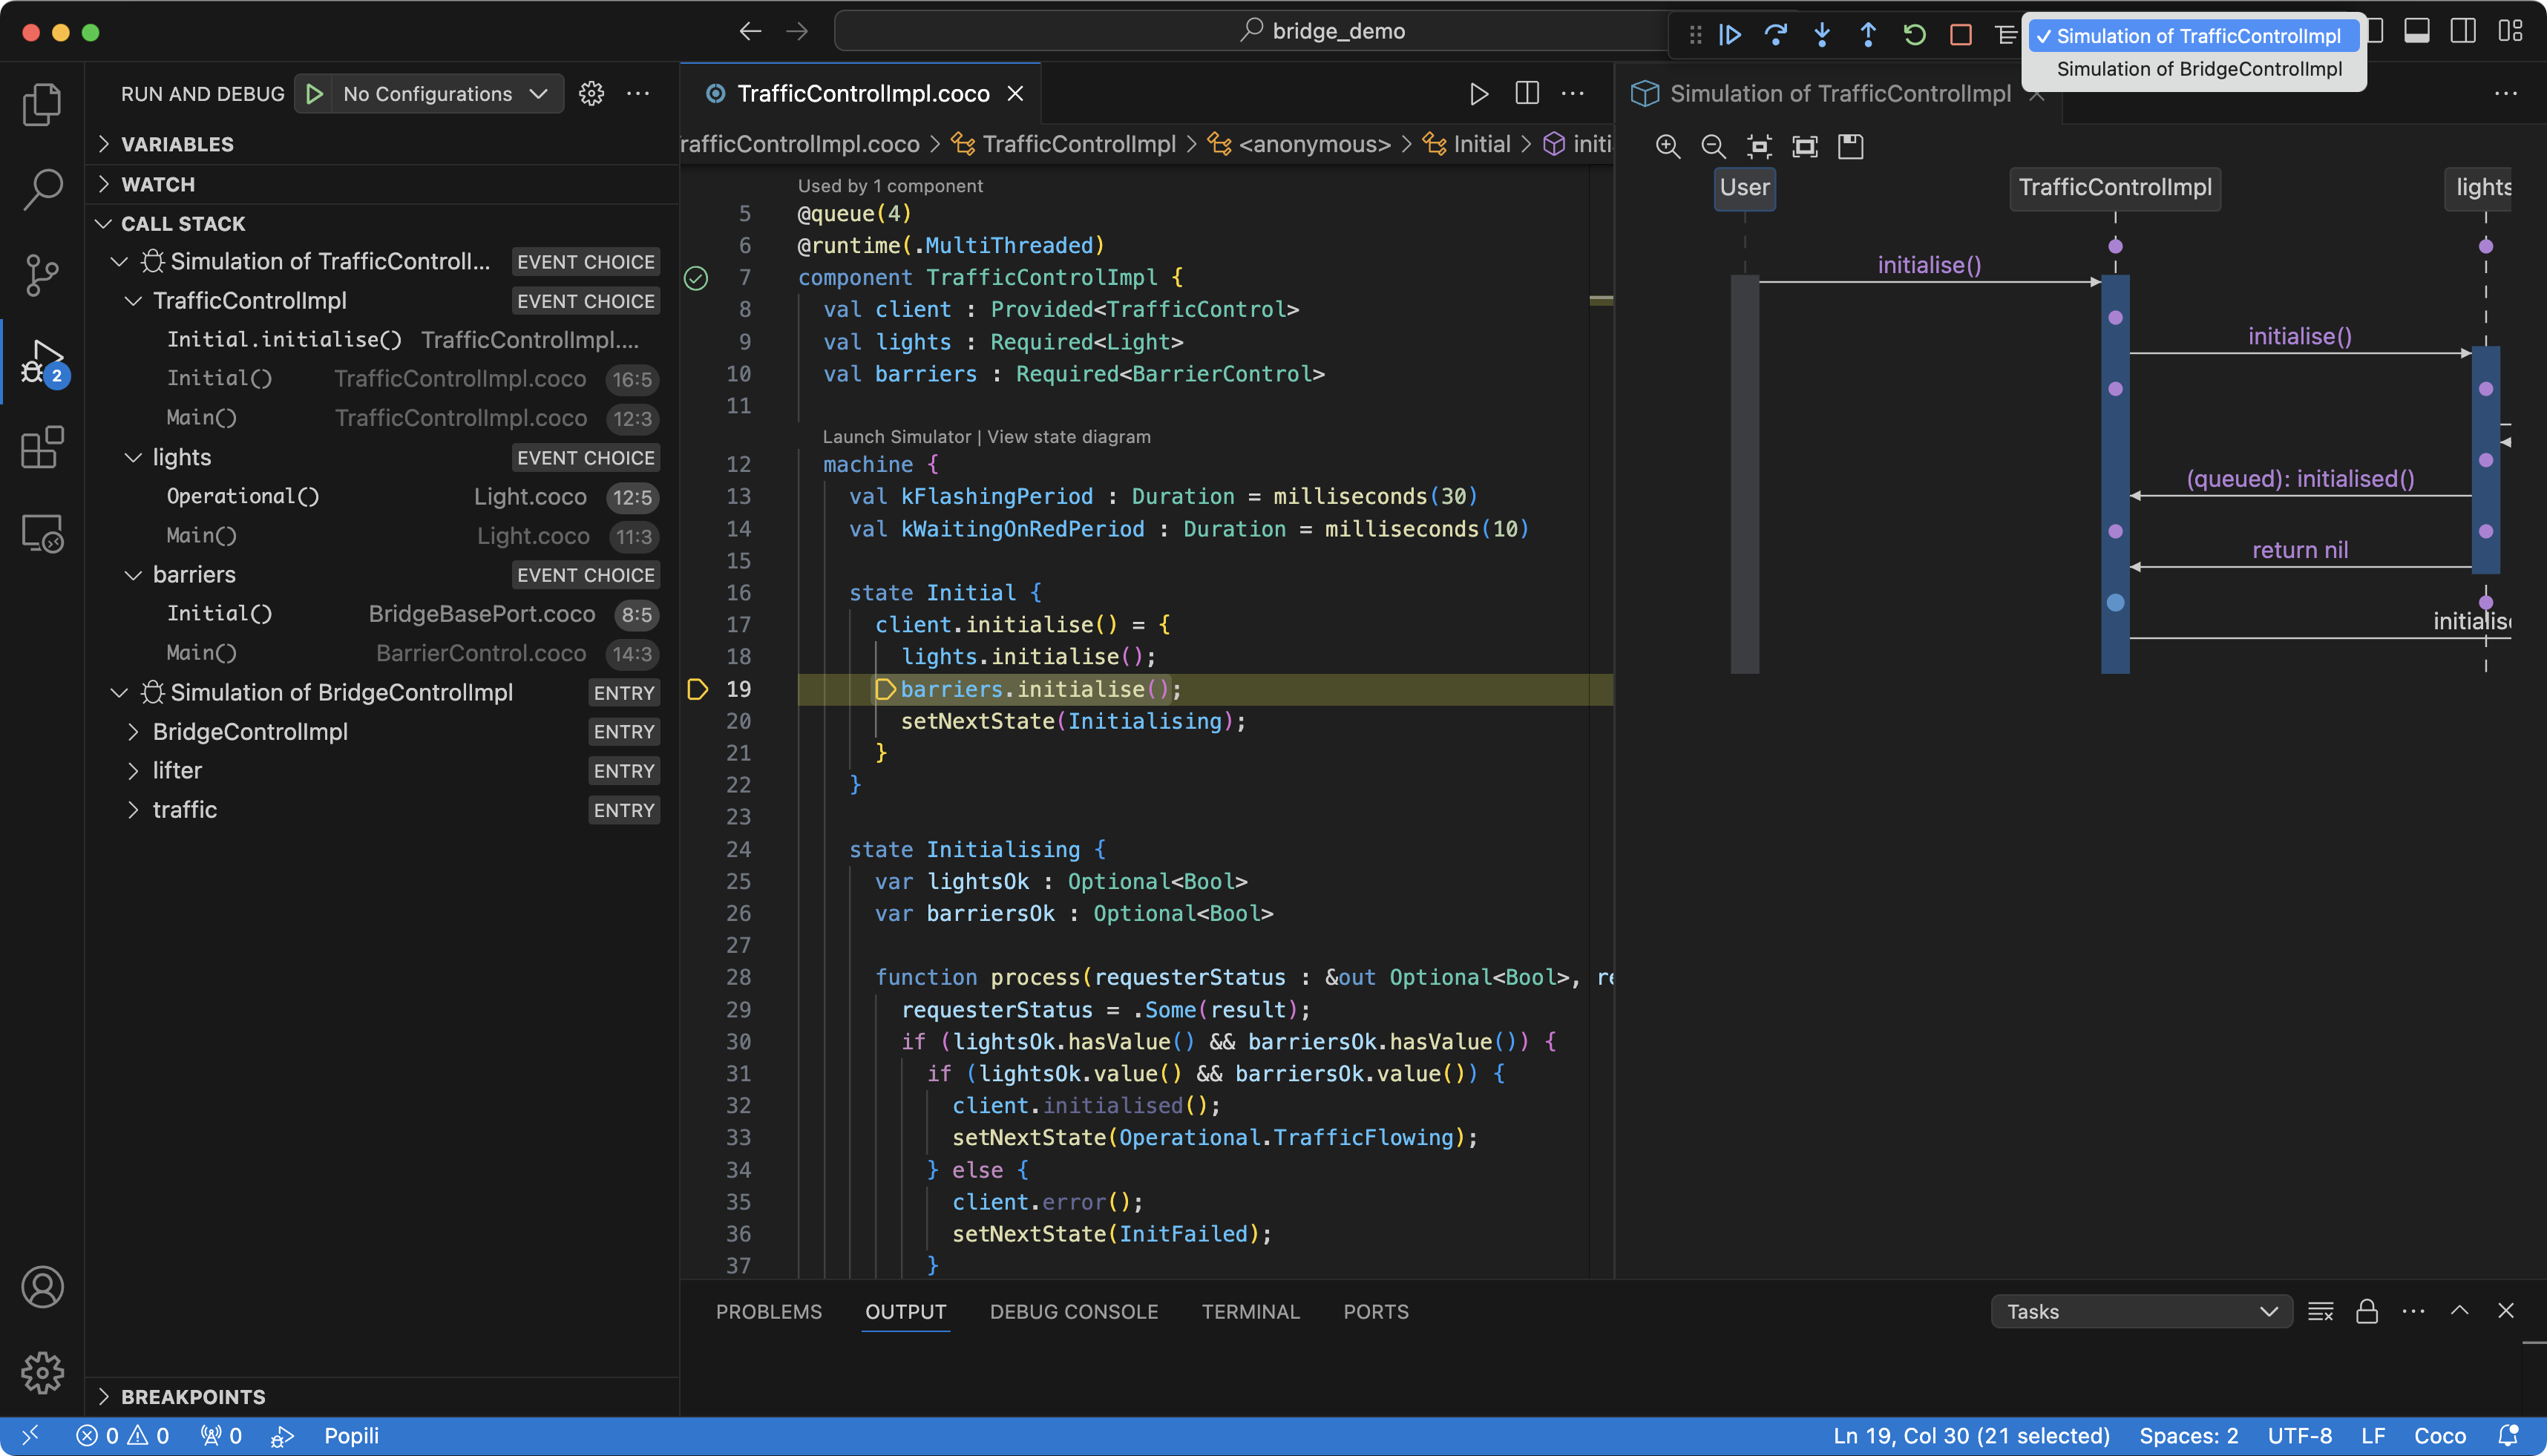
In this example above, two simulations are being run independently of one another, namely one simulating the TrafficControlImpl
component and the other simulating the BridgeControlImpl. If more than one simulation is active, then they will appear in a dropdown
list as part of the floating menu bar used to drive the simulator, as illustrated above. You can switch between them by selecting one
in this list. The Debug and Run view captures the usual additional information for all state machines being simulated.
To terminate one of multiple simulations, select the simulation and then click on in the simulator menu choice. This will close the chosen simulation only, without closing all simulations. In contrast, if the tab of the Simulation view is closed (by closing the tabbed header containing the simulation in view), then this will close the Simulation view entirely, thereby terminating all active simulations.
Watching Variables
Popili allows you to select variables to watch in the Counterexamples View or Simulator for Coco, resulting in them being added as annotations, together their values, in the corresponding sequence diagram. The following example illustrates the addition of variable annotations in a simulation sequence diagram:
Variables are selected and deselected by clicking on the Add Variable Annotation icon next to the corresponding variables as follows:
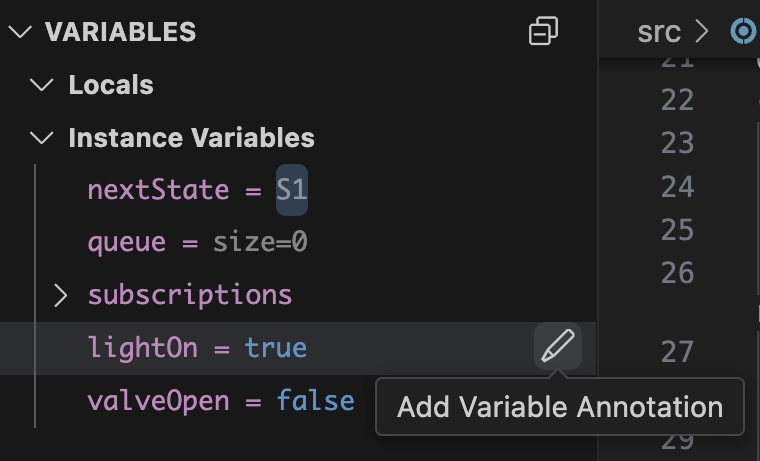
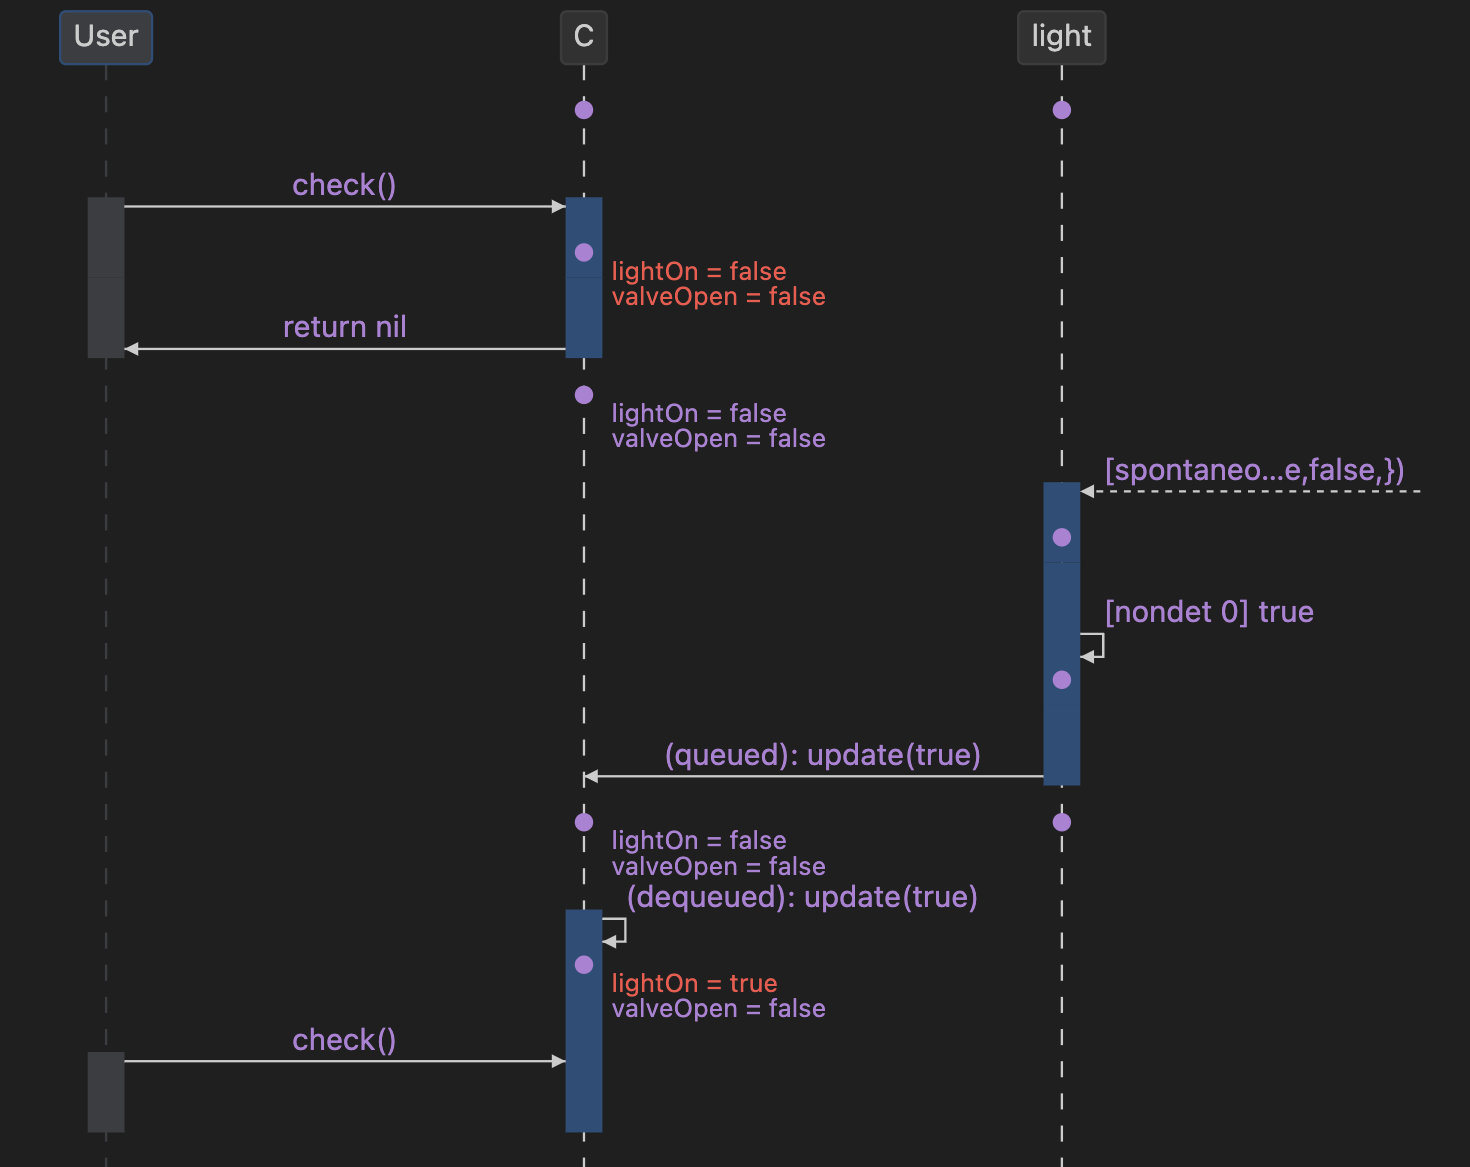
This option can be found in VS Code’s Debug and Run view under the Variables menu. In the example above, the
variables lightOn and valveOpen in the component C are selected, resulting in them being added
as annotations on every state in the sequence diagram to which they apply (i.e. where they are in scope). The annotation
is shown in red whenever a variable’s value changes.
Values are displayed for watched variables of primitive (or leaf) types, as well as for complex nested structures and arrays. In addition, individual elements of a structure or an array can be selected instead, and view the corresponding values in the sequence diagram.
This list remembers all of the variables that you have chosen to watch in the lifetime of the current counterexample or simulation. You can toggle the variables on and off as required, and the list is only cleared when the diagram is closed, or a new one is loaded.
The variable annotation labels can be modified by going to the Variable Annotations menu and clicking on the Set Annotation Label icon next to the corresponding variables as follows:
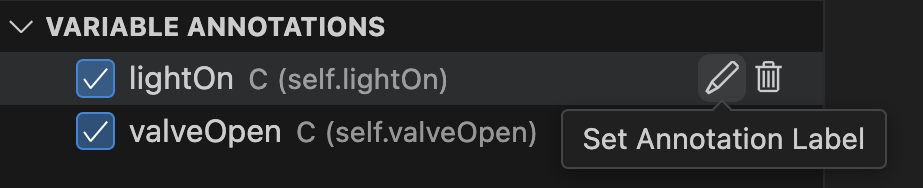
In this example, the default labels self.lightOn and self.valveOpen have been renamed to lightOn and valveOpen, and
are illustrated in the simulation sequence diagram above.
Visualising Architectures
Popili allows you to automatically generate architecture diagrams for encapsulating components. You can generate these diagrams in the following ways:
- Hover over an encapsulating component in Popili’s Assertions view and click on , which appears next to the assertion.
- Click on Open Diagram in the code lens immediately above encapsulating components inline.
- Open the Command Palette and search for Popili:View Architecture Diagram.
An architecture diagram will be displayed in a new tab as illustrated below:
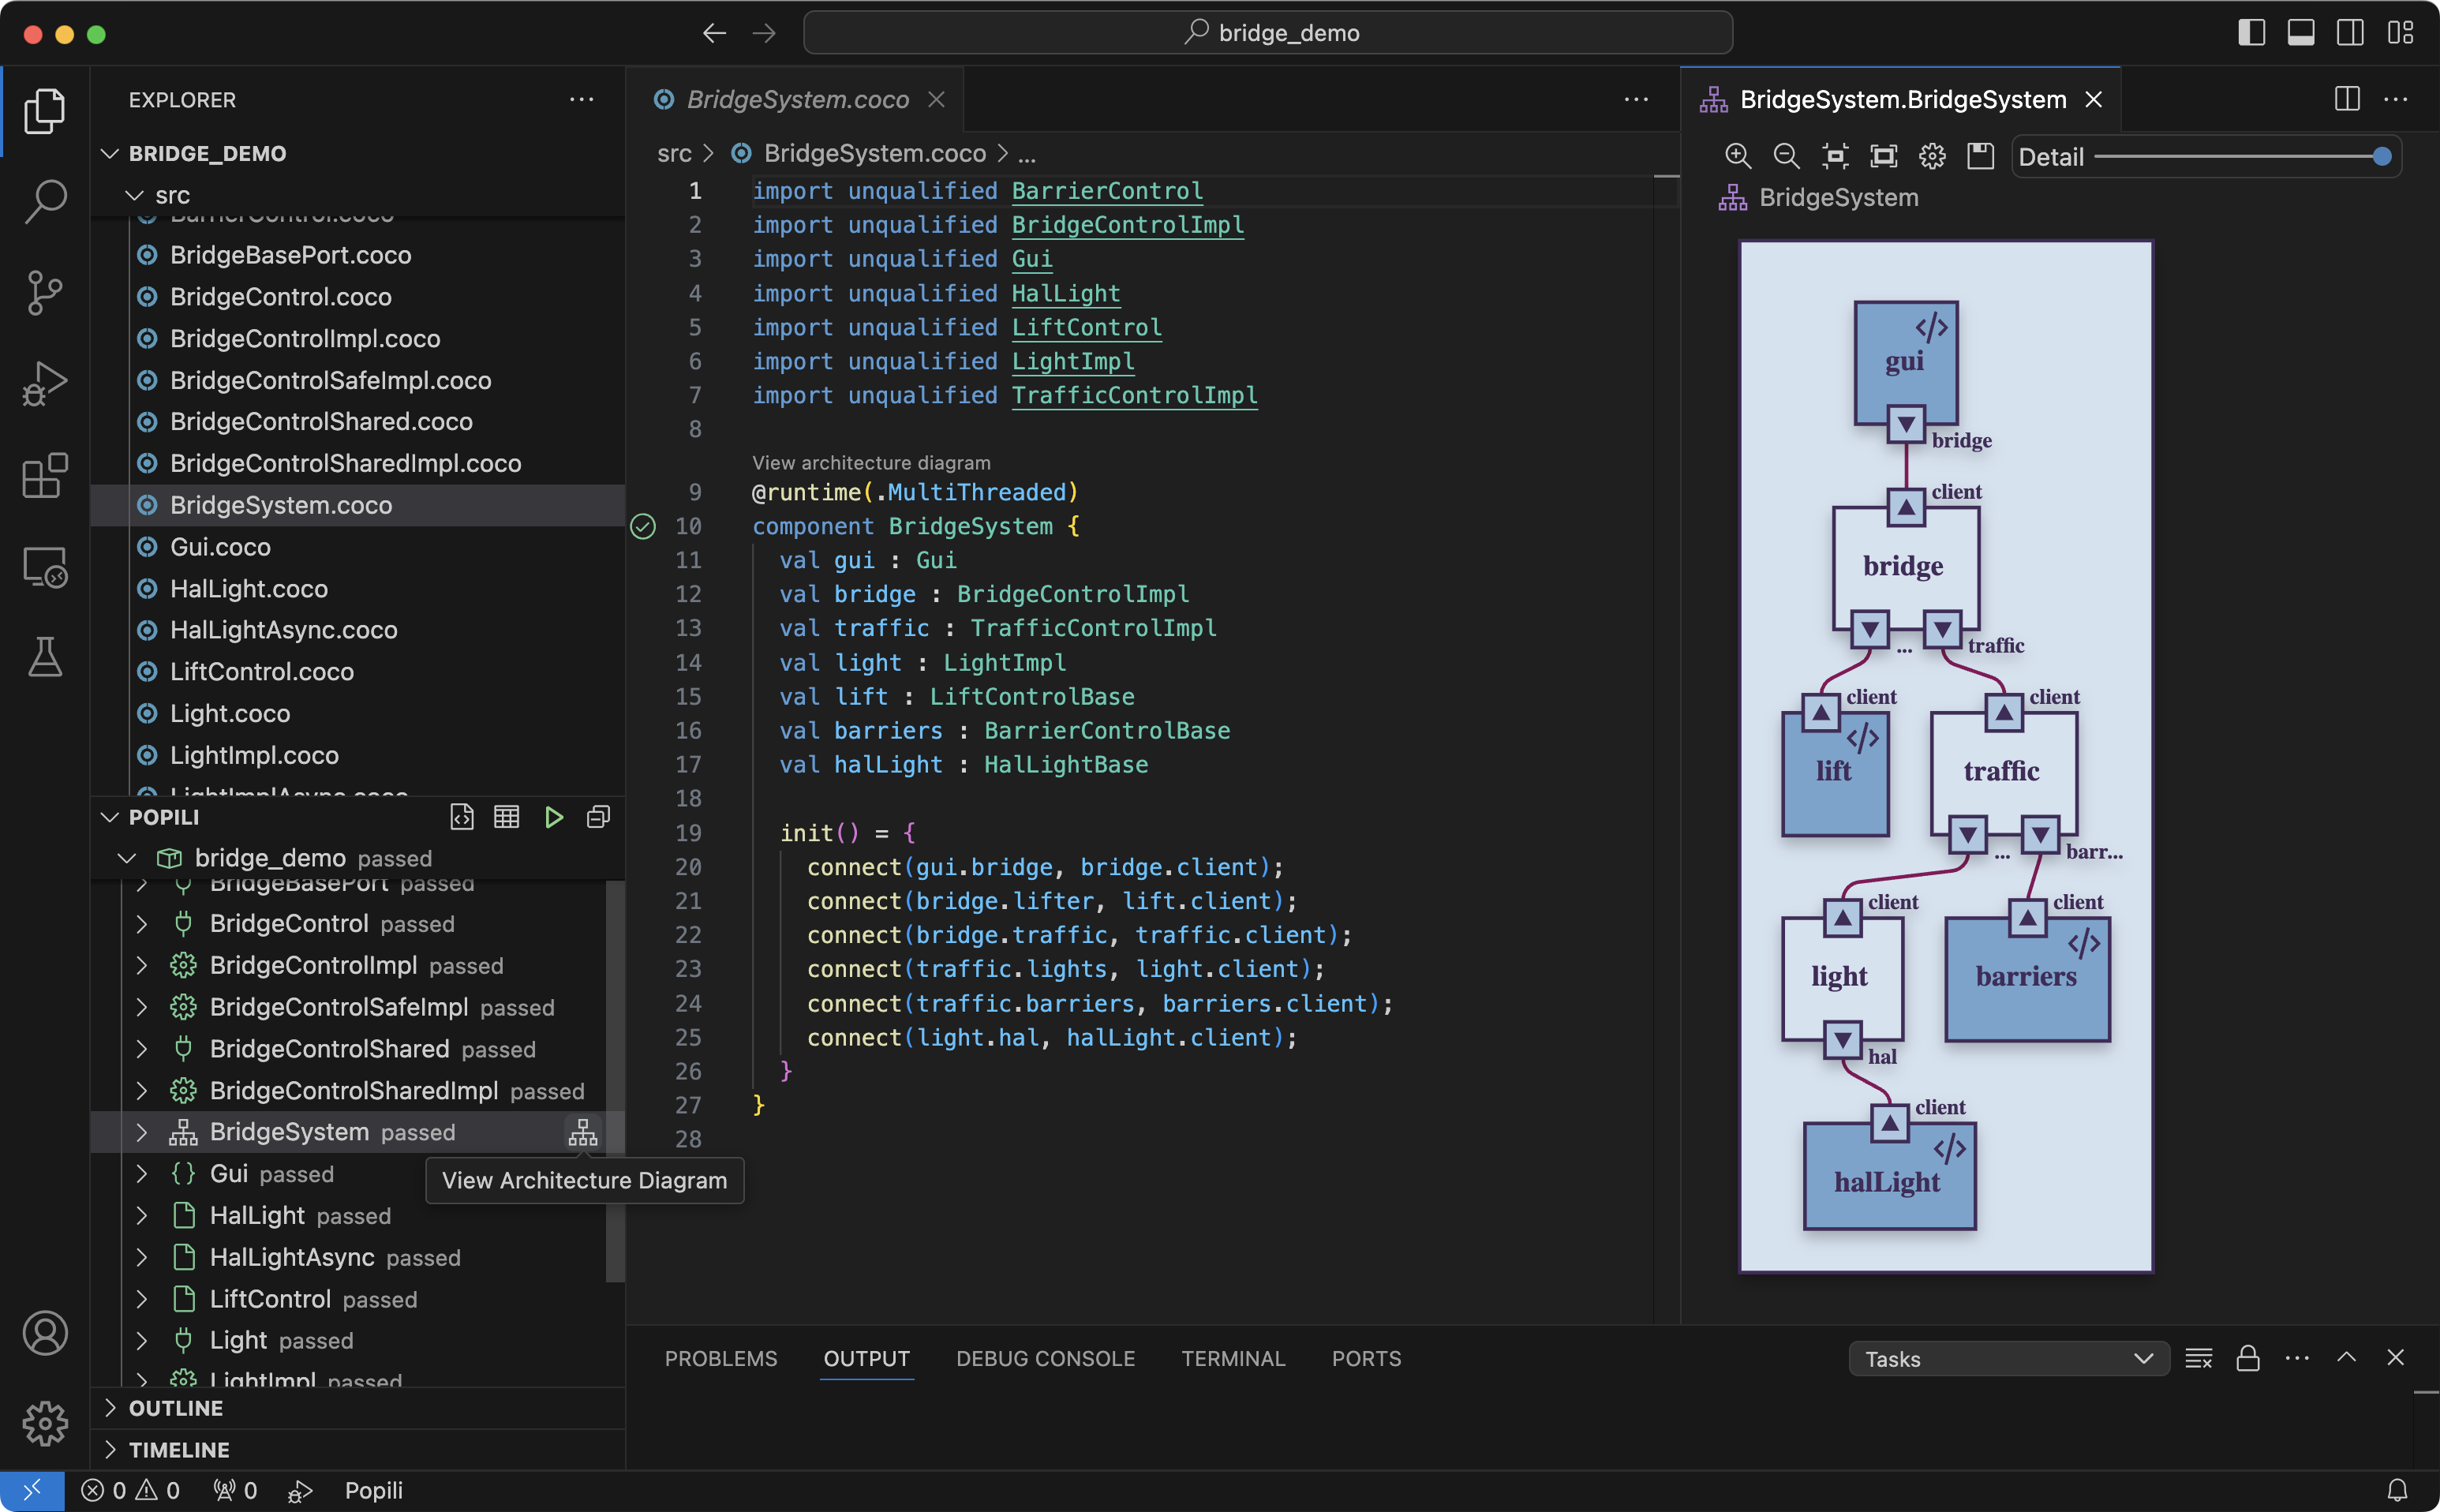
This graphical representation displays all the components and ports declared in the encapsulating component, together with their
connections as specified in the constructor. The diagram also uses the colour conventions defined in the
Graphical Conventions section of the Coco Language Reference to denote
the runtime and type for each component. For example, in the diagram above, the colours and markings denote that
BridgeSystem is a multi-threaded encapsulating component consisting of a number of multi-threaded components within
it, where bridge is an example of an implementation component, and gui is an example of an
external component.
See also
Coco also supports multi-threaded encapsulating components consisting of single-threaded components within them. See Mixed Runtime for further details.
If you hover your cursor over any component or port in the architecture diagram, they will be highlighted in red, together with the ports they are connected to:
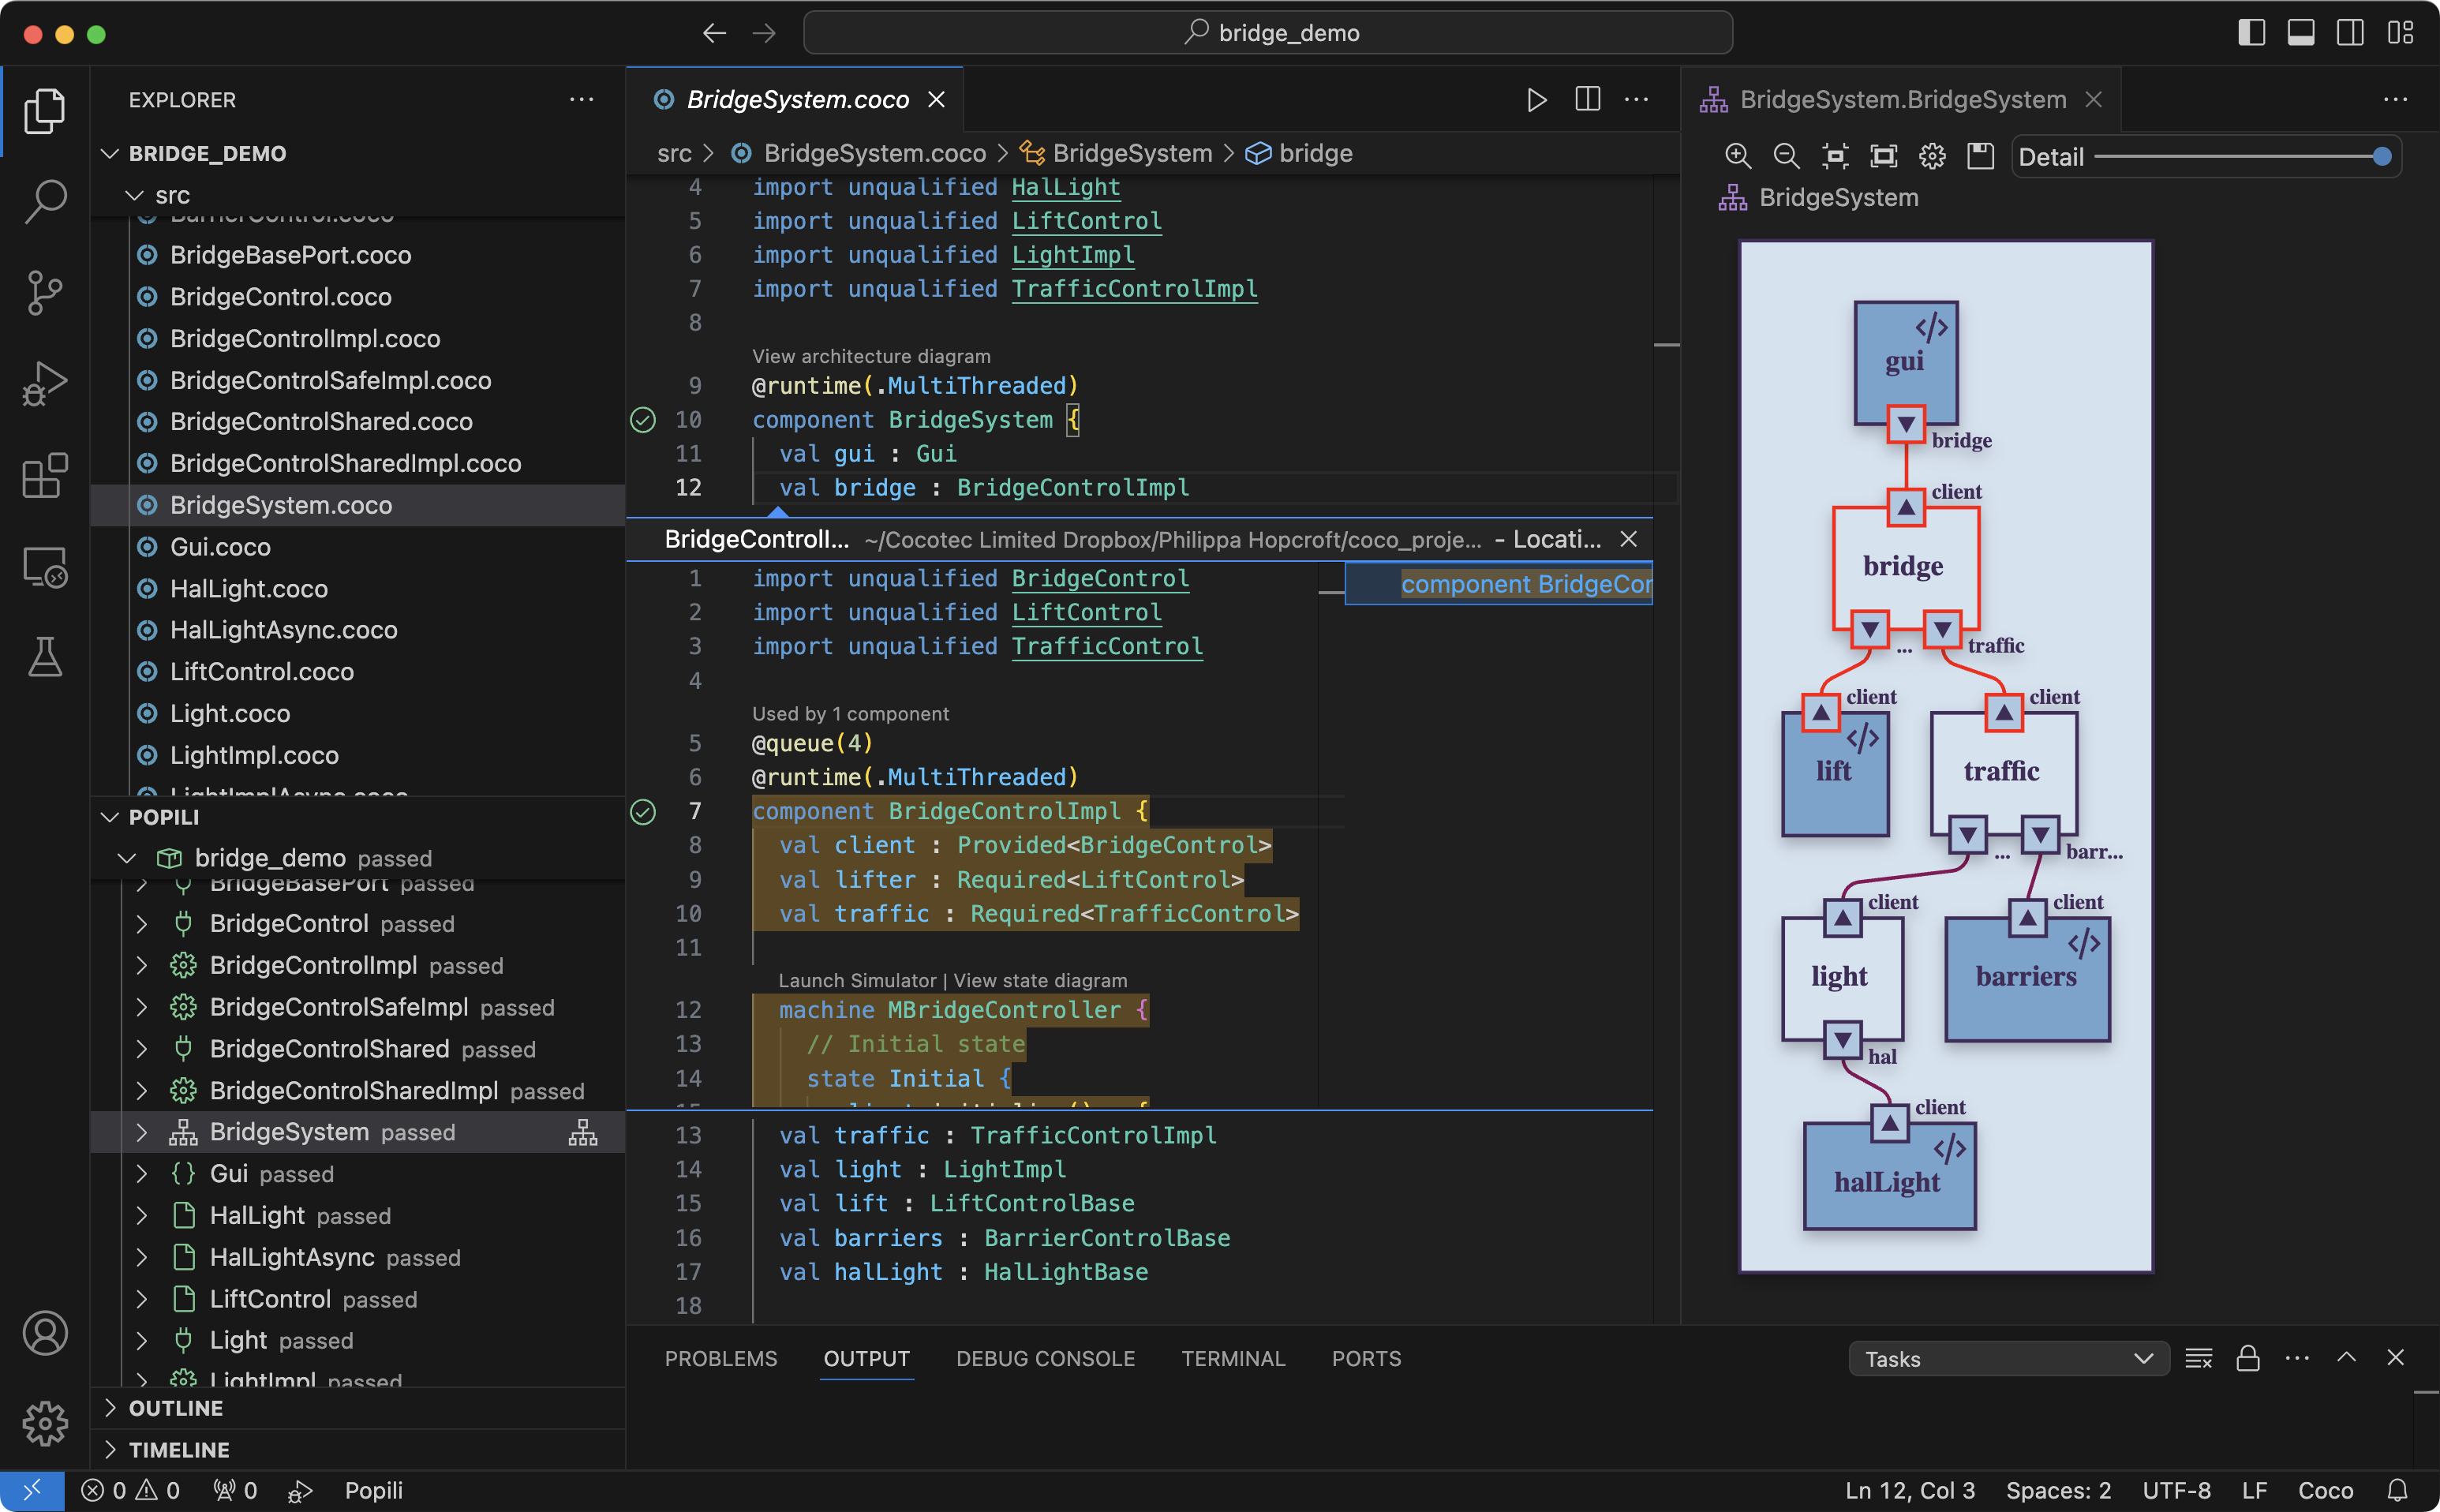
Further, if you click on any component or port in the diagram, the Coco module it is declared in will be opened in the Coco Editor, and its corresponding declaration will be highlighted as shown above.
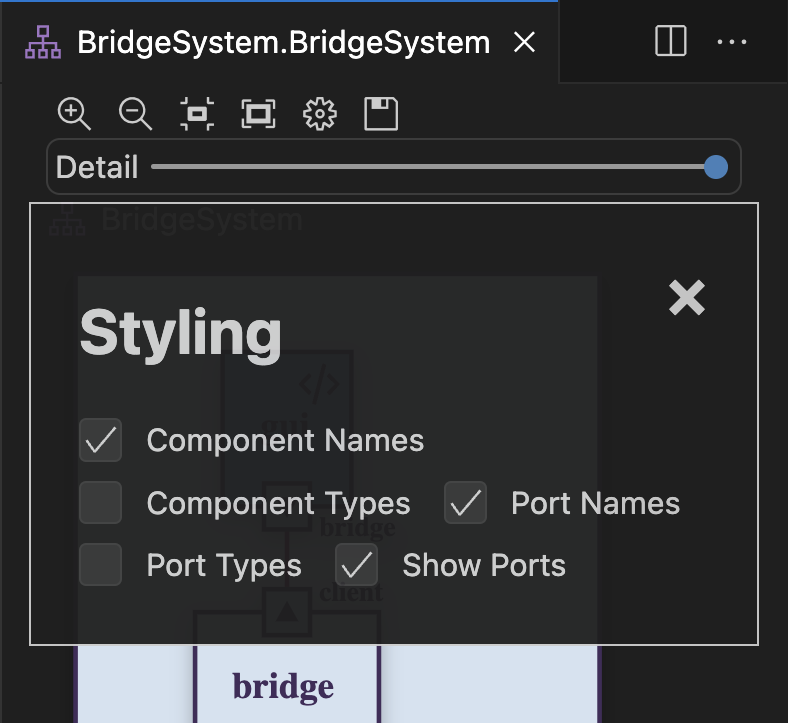
The Architecture Diagram view’s toolbar provides you with the standard options for saving the diagram, setting the size of the image to fit within the existing view, and zooming in and out. There is also a slider ranging from Least Detail to Most Detail, which allows you to select the depth of component nesting displayed. Further, you can edit the diagram style by clicking on . This results in a popup menu where you can select whether to display component names, component types, port names, and port types in the architecture diagram:
By default, the architecture diagrams are updated automatically when the code is changed, as summarised in Live Updates.
Visualising State Machines
Popili allows you to automatically generate different views of your port and component state machines, the choice of which depends on the information of interest. One of the views is a graphical representation of a port or component state machine, which provides an easy way to visualise all the states and see the transitions between them. An alternative view of a Coco state machine is provided by the Structure Viewer, which provides an easy way to see a summary of which events are allowed in which states. Each view is described in turn below.
State Machine Diagram
You can generate a state machine diagram in the following ways:
- Hover on a port or component that has a state machine in Assertions view, and click on that appears next to it.
- Click on Open Diagram in the code lense immediately above a Coco state machine inline.
- Open the Command Palette and search for Popili:View State Diagram.
A state machine diagram will be displayed in a new tab as illustrated below:
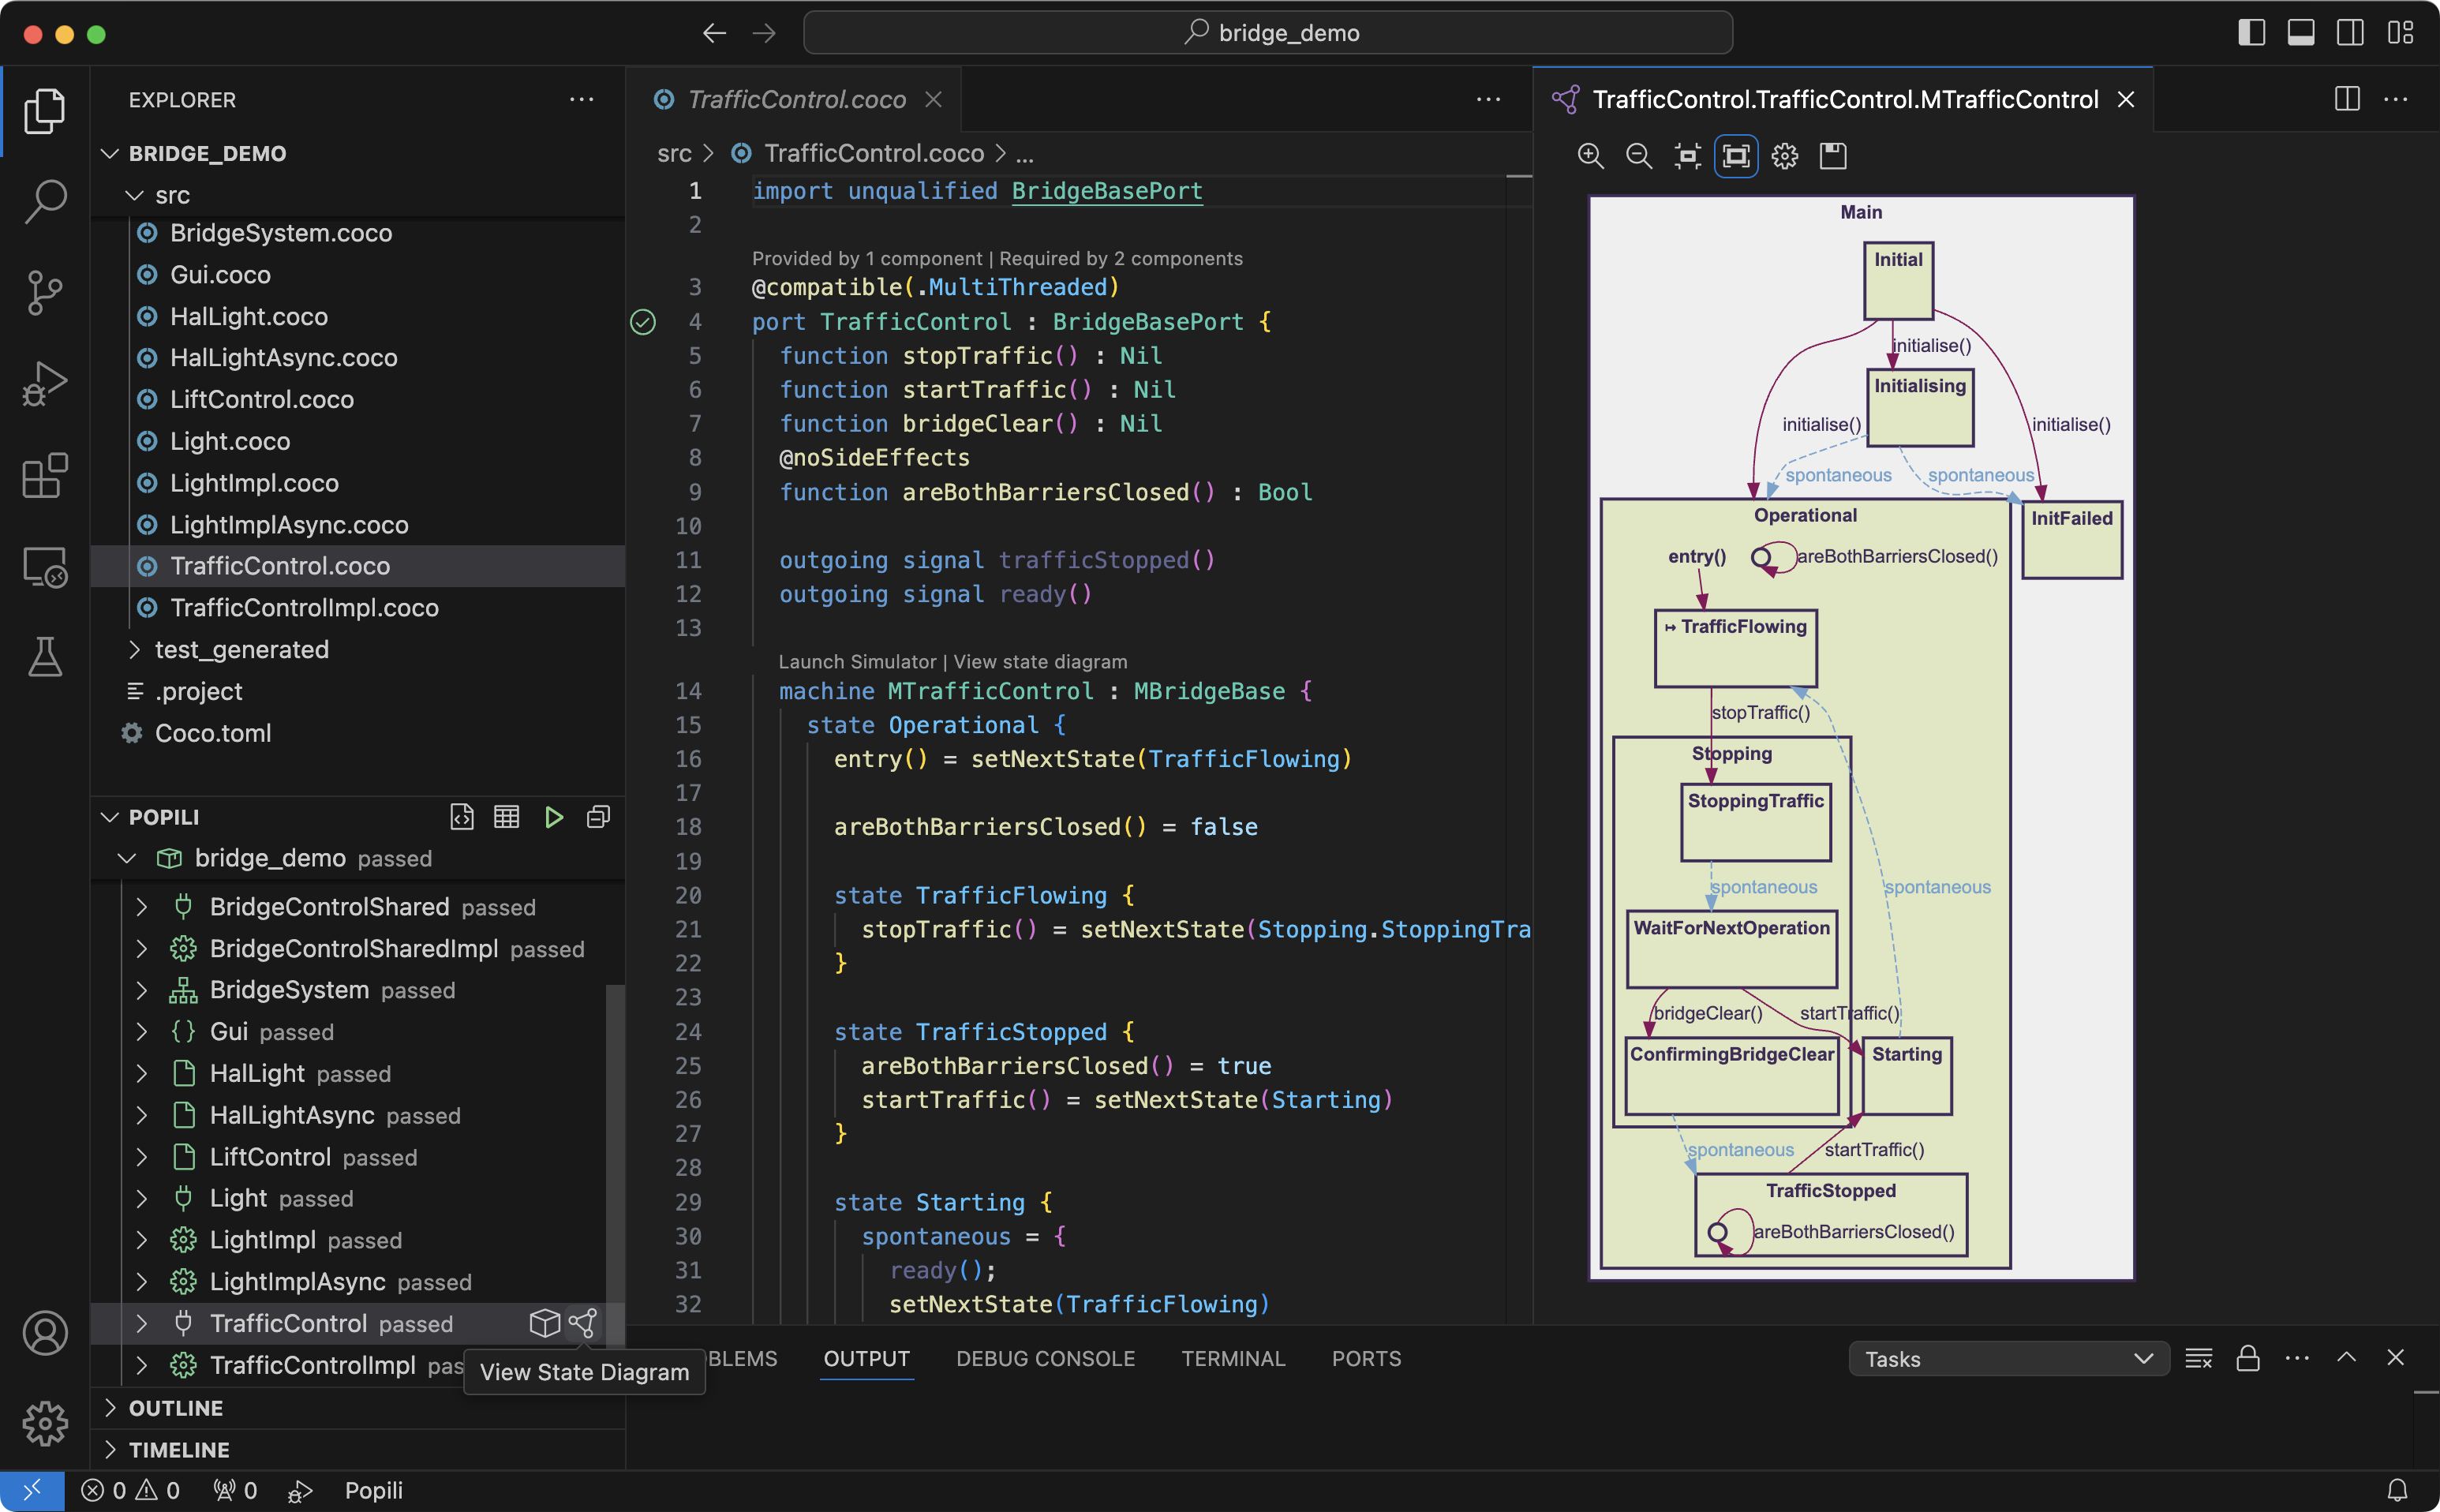
This graphical representation displays all of the states declared in a Coco state machine as rectangular nodes that are
labelled with their corresponding state identifiers. The state hierarchy is also preserved in the graph; for example,
the node labelled Stopping is displayed within the node labelled Operational, which means that
Stopping is declared as a nested state within the Operational state in the corresponding Coco state machine.
The state machine diagram also displays all of the transitions declared between the states as directed edges between the
nodes. These edges are either labelled with their corresponding event names, or with the labels specified in the
@represents attribute where relevant.
If you hover your cursor over any states or transitions in the state machine diagram, they will be highlighted in red. For a transition, the corresponding source and destination are also highlighted; and for a state, the transitions declared in it are highlighted, as illustrated in the following example:
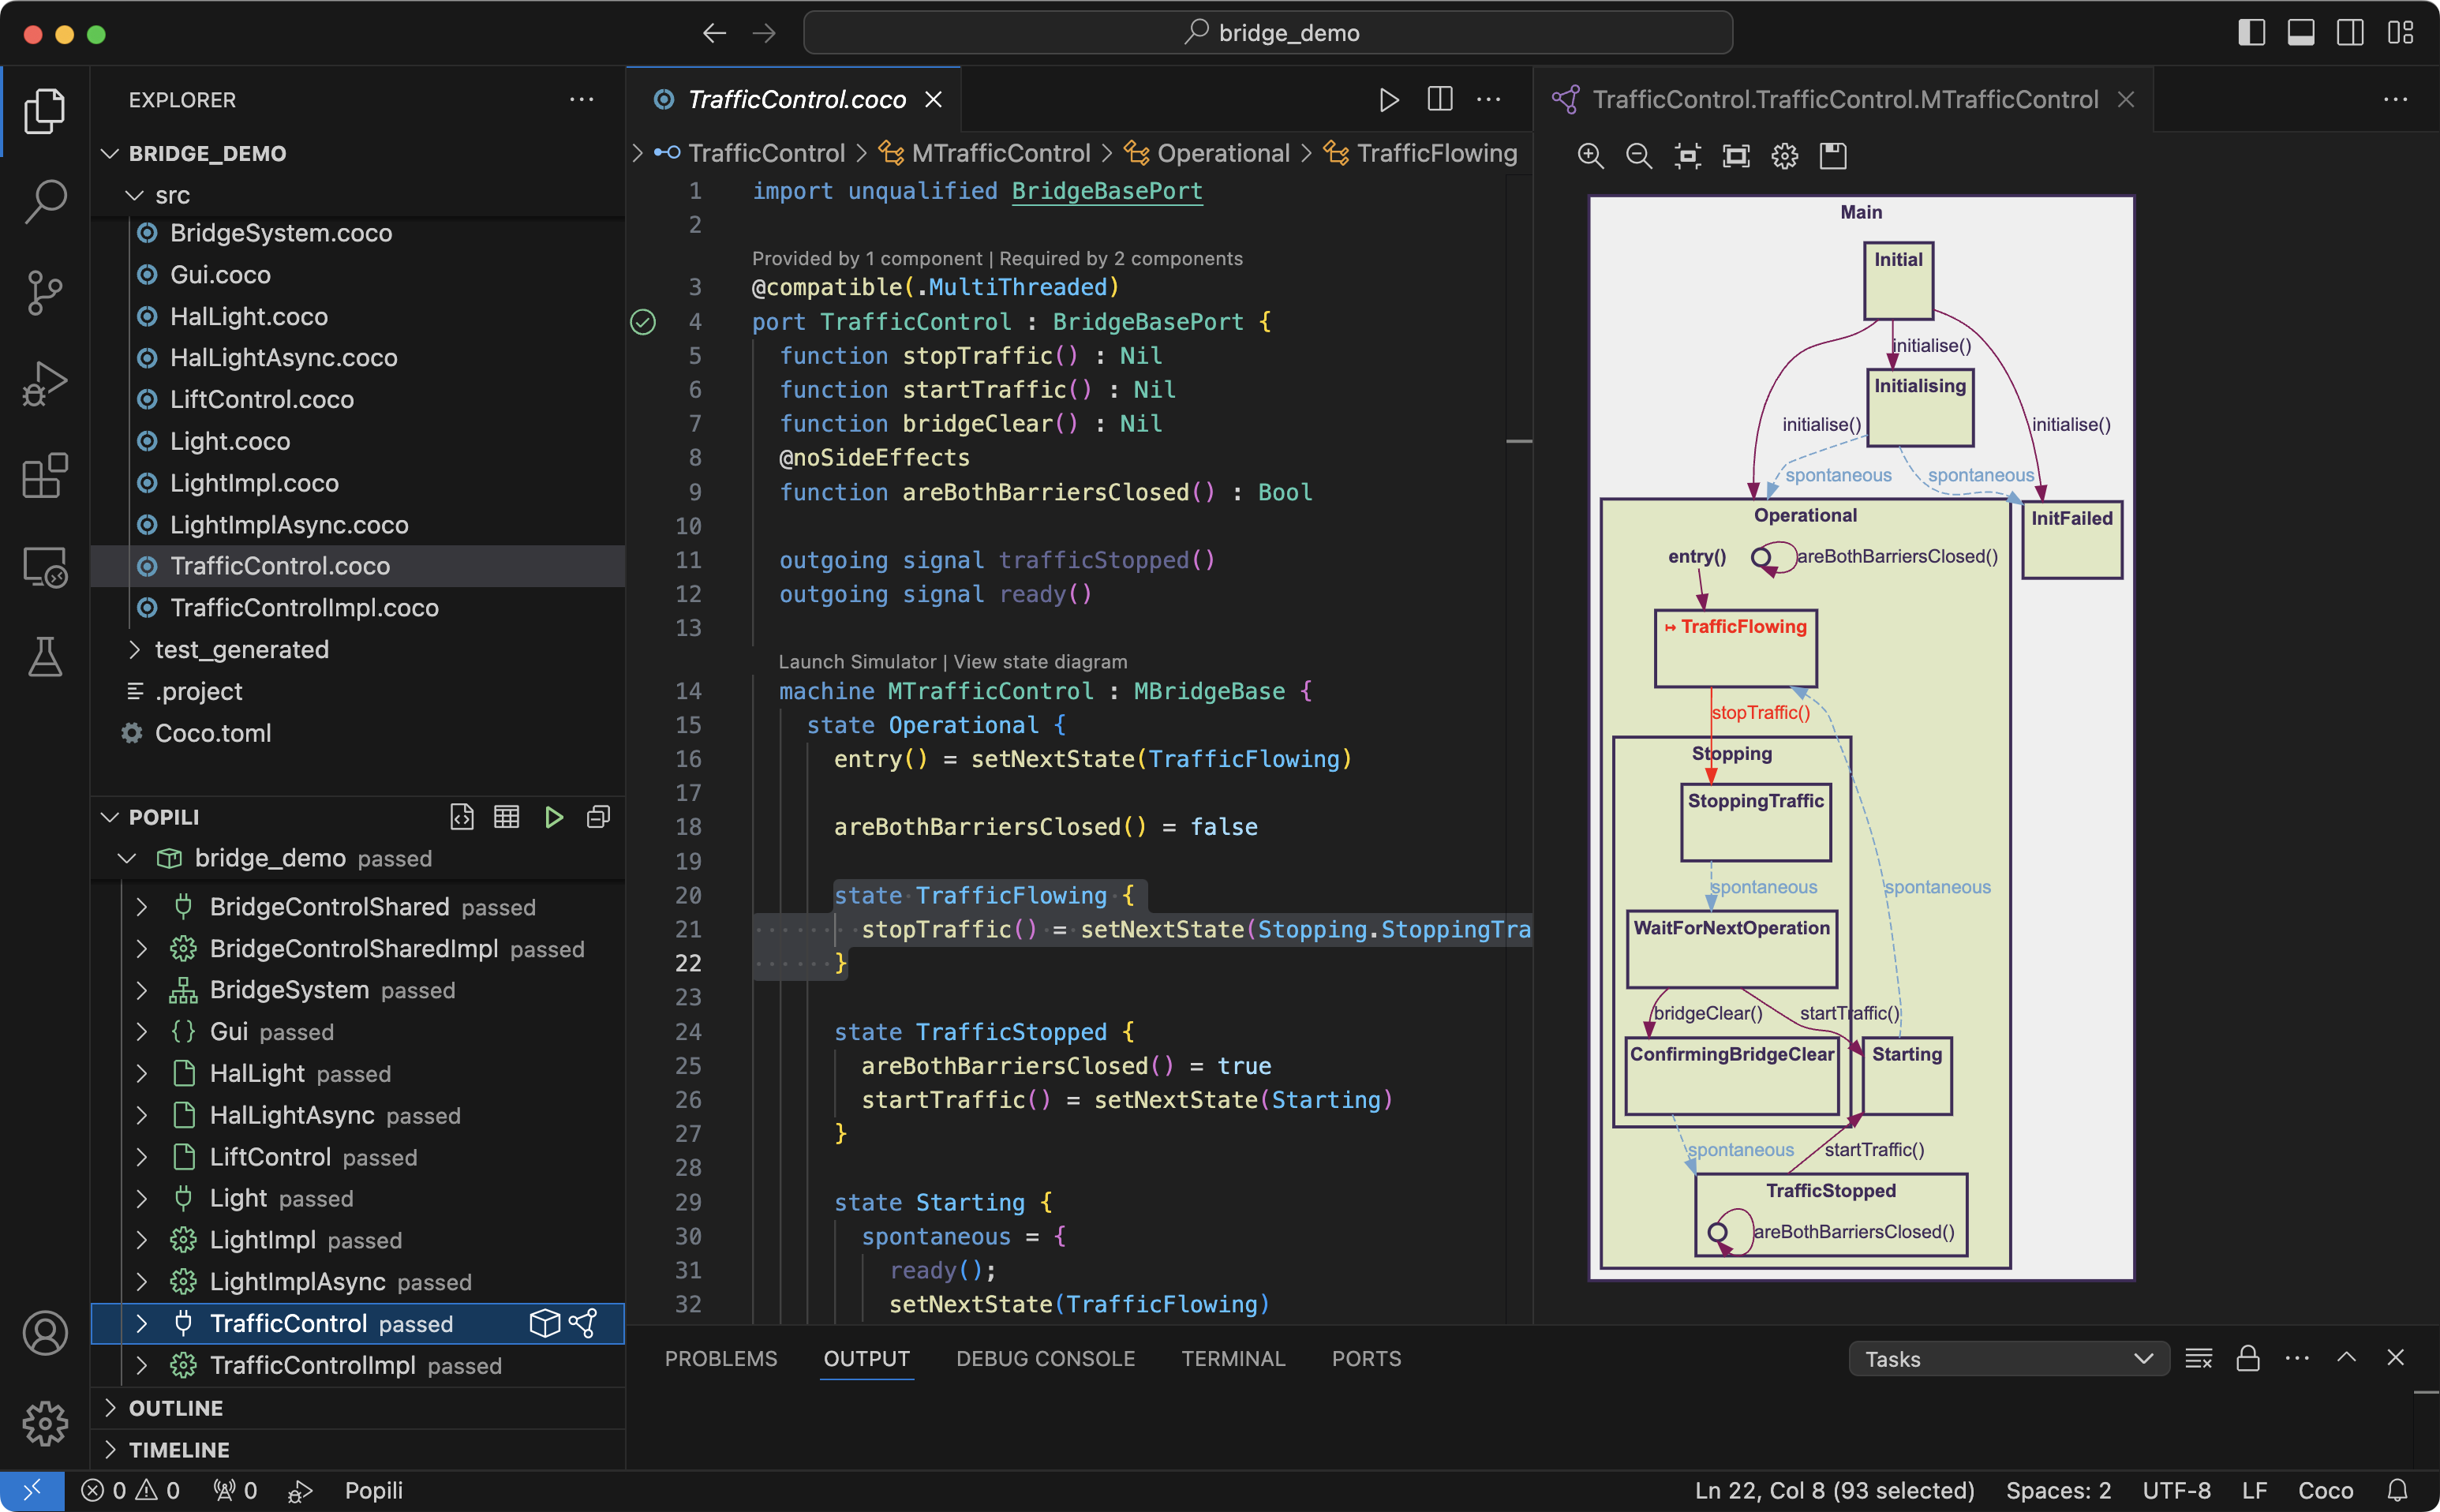
Further, if you click on any state or transition in the diagram, the modules they are declared in will be opened in the Editor and their corresponding declarations will be highlighted as illustrated above.
The State Machine Diagram view’s toolbar provides you with the standard options for saving the diagram, setting the size of the image to fit within the existing view, and zooming in and out. In addition, you can edit the diagram style by clicking on , which results in the following popup menu:
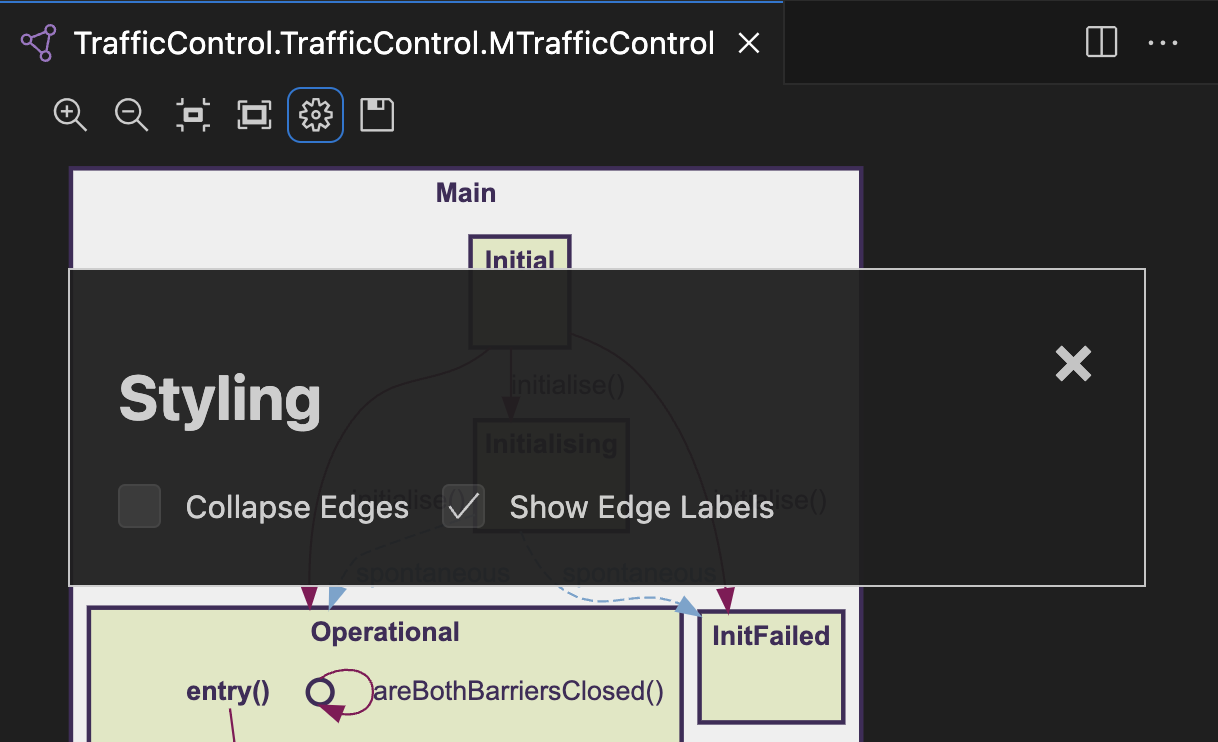
This menu provides the following two options for editing state machine diagrams:
- Expand/Collapse Edges: This option allows you to choose between an expanded representation of the graph, where there is an individual directed edge for every transition declared between two states, or a collapsed representation where all of the event names of the transitions between the same two states are displayed in a list on a single directed edge.
- Show/Hide Edge Labels: This option allows you to display or hide the labels on the graph edges.
By default, the state machine diagram is shown with the edges collapsed and labelled.
State machine diagrams are updated automatically when the code is changed by default, as summarised in Live Updates.
Structure Viewer
Popili allows you to automatically generate a structure diagram in a tabular form for port and component state machines, which provides an easy way to see a summary of which events are allowed in which states.
You can generate a structure diagram either by:
- Hovering on a port or component that has a state machine in Assertions view, and clicking on the icon that appears next to it, or
- Clicking on Open Table in the code lense immediately above a Coco state machine inline.
These options are highlighted below:
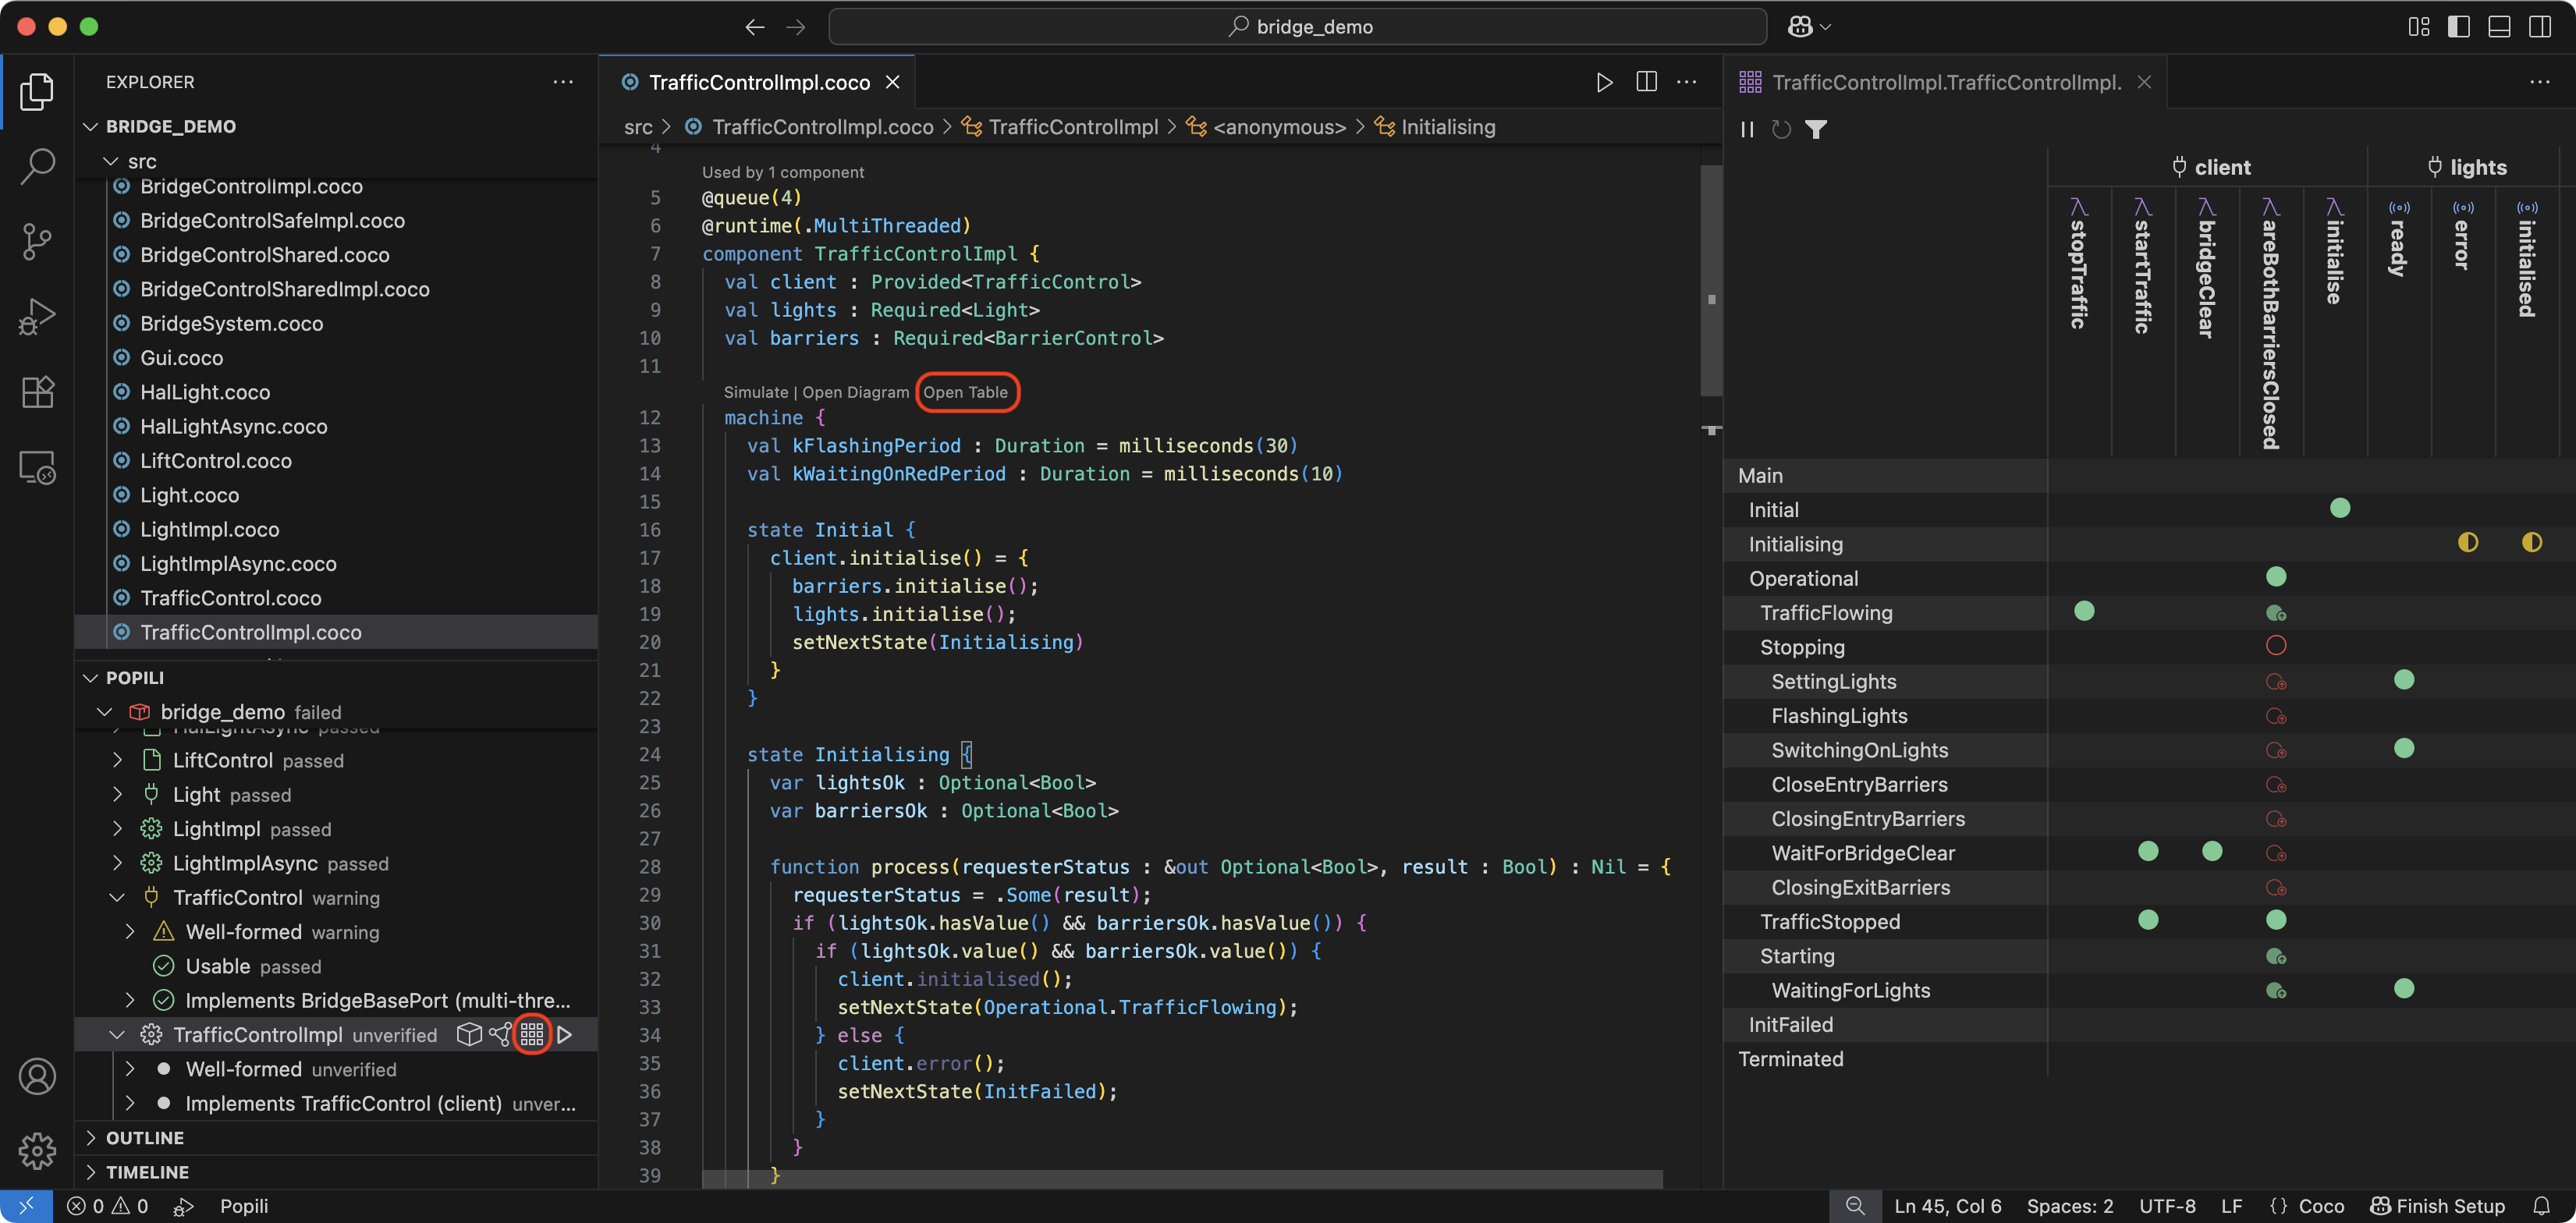
The complete structure view for the TrafficControlImpl component state machine is as follows:
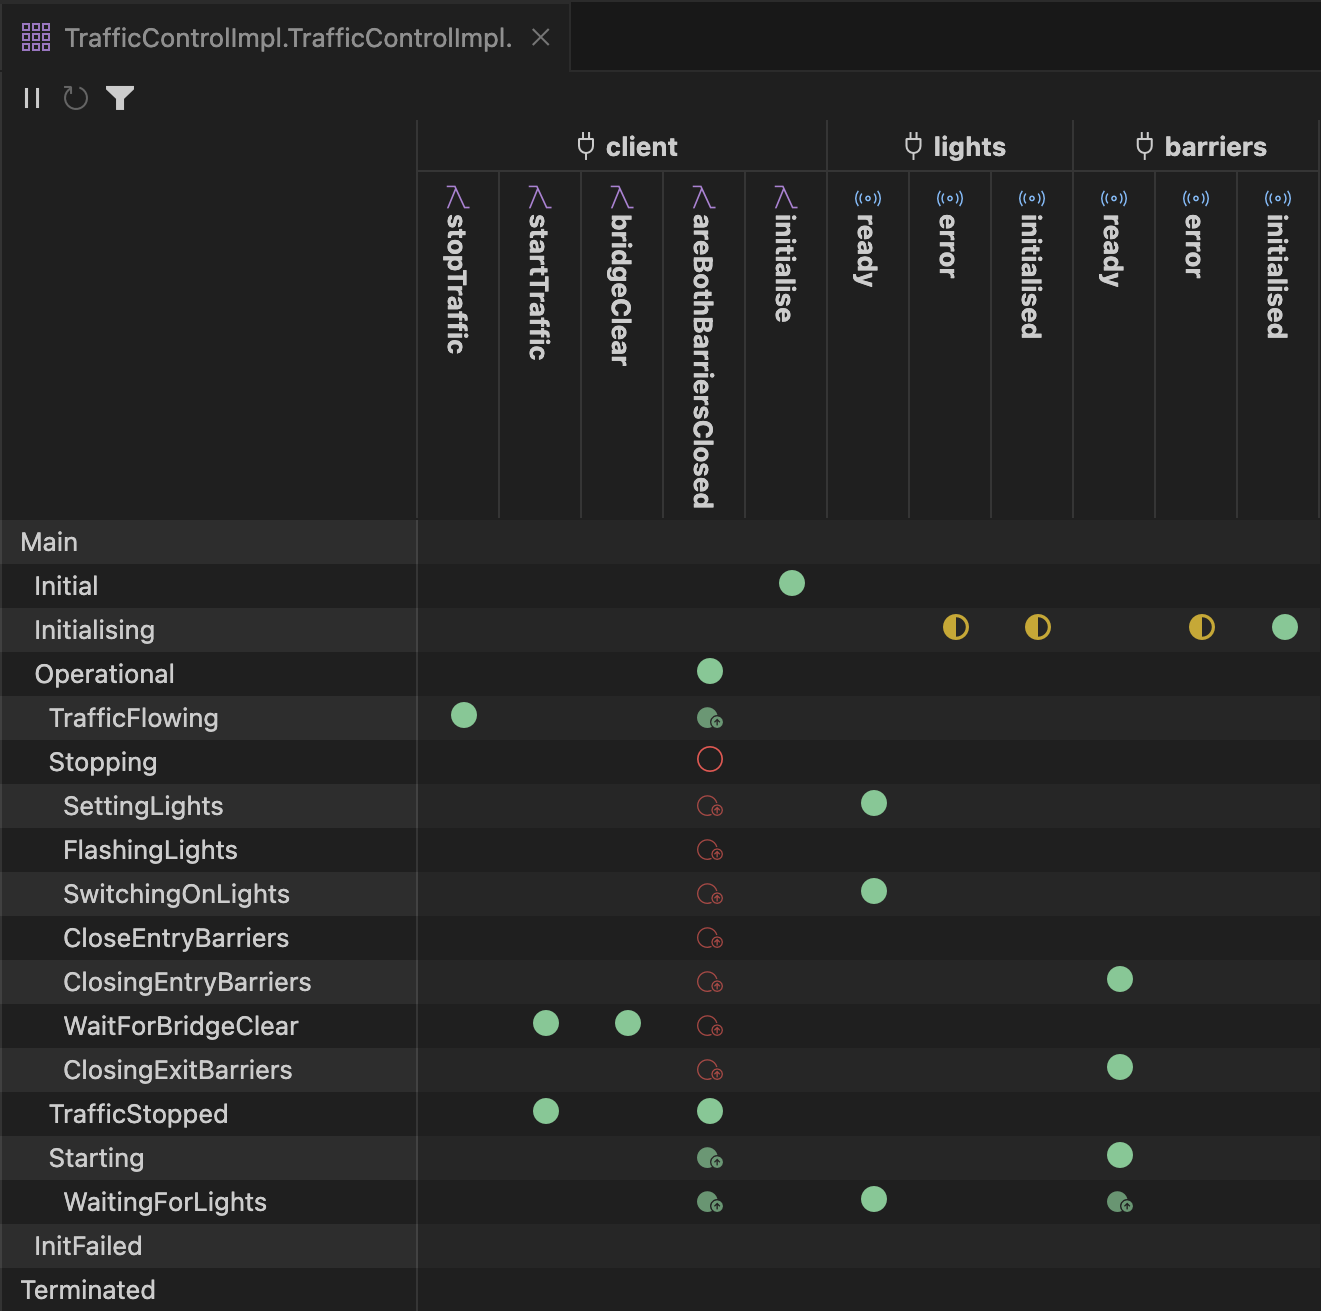
The states are listed in the first column, and are indented to reflect the state hierarchy. The top two rows list the function calls that can be called on components or ports, and in the case of components only, the signals that they can receive. The signals are listed under the required ports from which they originate. For every event and state pair in the structure viewer, either the entry is blank, indicating that no transition is declared for this event in this state, or it has one of the following icons:
| Icon | Meaning |
|---|---|
| A legal transition for this event is declared, and is therefore allowed in this state. | |
| This state inherits a legal transition for this event declared in a parent state. | |
This event is explicitly declared as illegal in this state. |
|
This state inherits a transition for this event declared in a parent state, which explicitly declares it
as illegal. |
|
| A transition has been conditionally declared (for example, a guarded transition), and therefore may or may not be enabled in this state. | |
| This state inherits a conditional transition for this event declared in a parent state, and therefore may or may not be enabled in this state. |
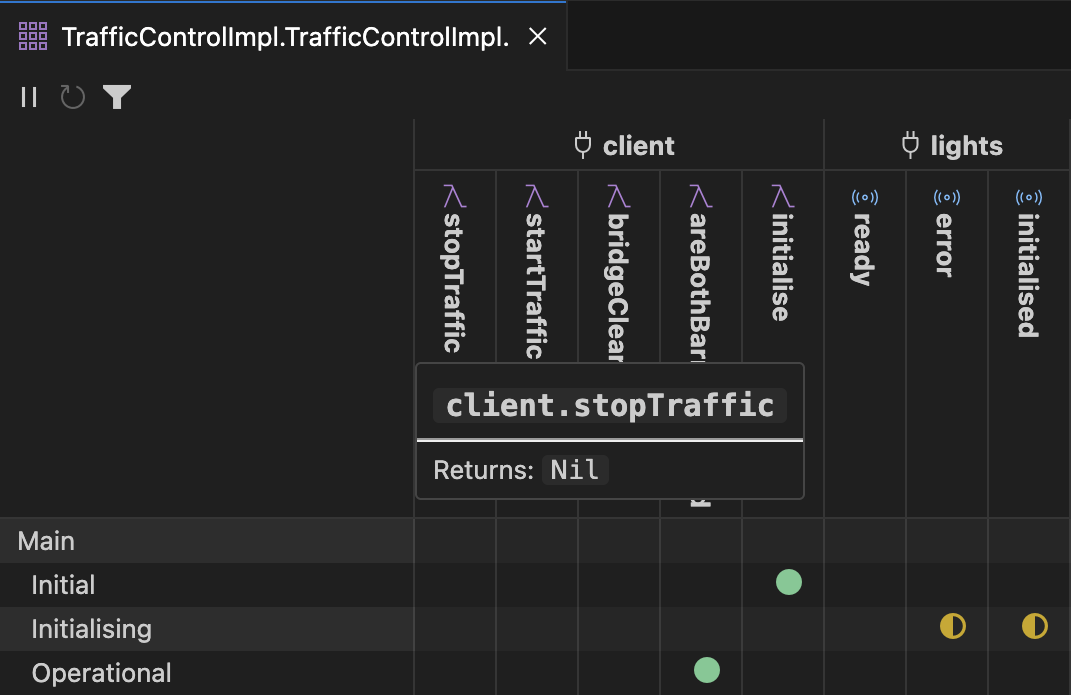
If you hover over any event listed, a tooltip will appear displaying the event’s declaration, together with the port instance within which it is declared:
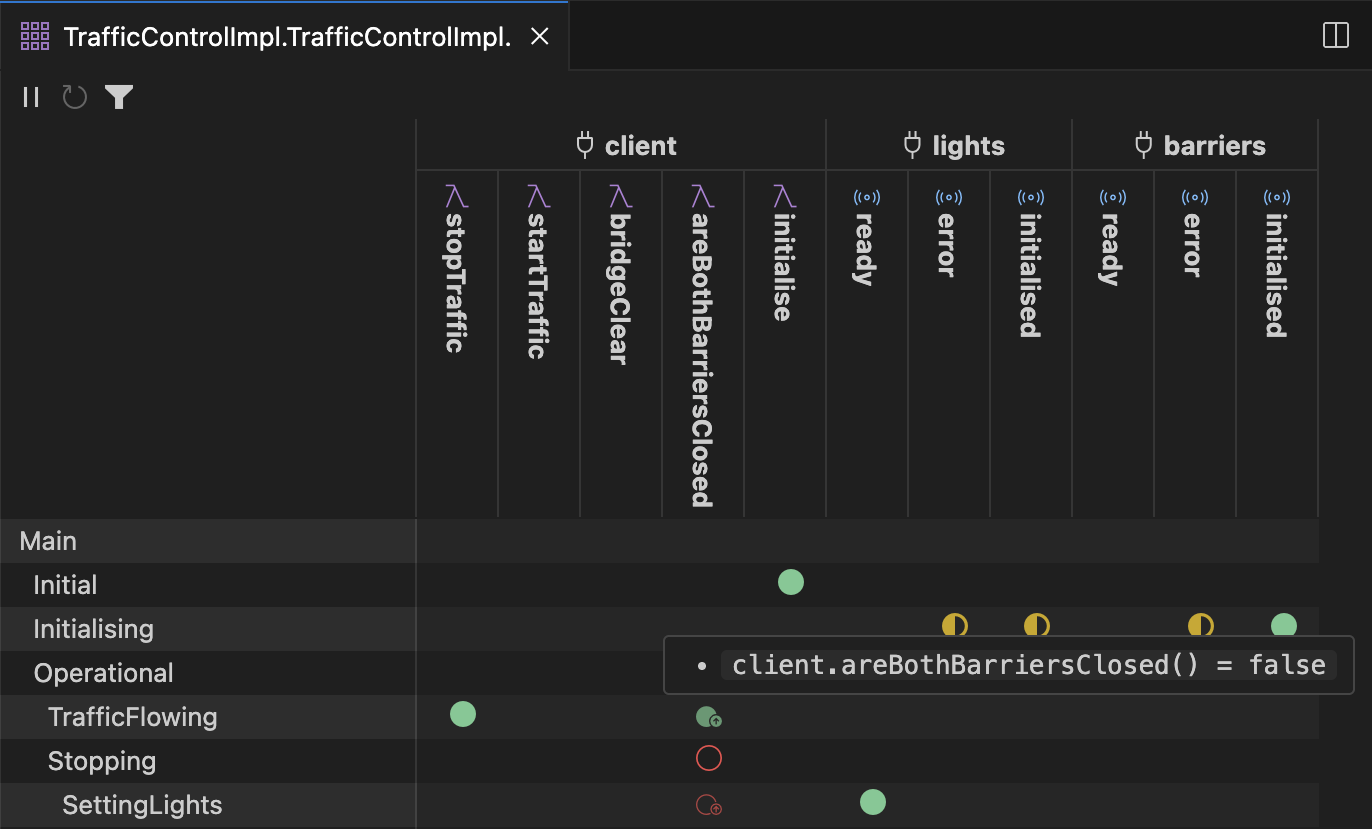
You can also hover over any of the icons in the structure viewer, and see a tooltip displaying the corresponding transition declaration:
By default, the structure diagrams are updated automatically when the code is changed, as summarised in Live Updates.
Live Updates
By default, the generated counterexamples and diagrams will update ‘live’ to reflect changes in the code, e.g. if one of the underlying ports or components is renamed. To suspend live updates, click on in the corresponding toolbar: code changes will no longer be automatically reflected in the diagram. The button (now shown as ) can be clicked again to resume live updates. Whilst paused, if Popili detects that the diagram is stale, the adjacent button will become enabled: click to force a one-off refresh of the diagram against the latest version of the code. The live update mechanism uses a heuristic to link the altered code to the diagram, so will not work reliably if the component as originally rendered no longer exists in your code in a recognizable form.
Generating Code
Once your Coco project passes all of the verification checks, you can automatically generate the code in one of the target programming languages supported by Popili either by clicking on in the Assertions view menu, or selecting one of the following commands in the prompt:
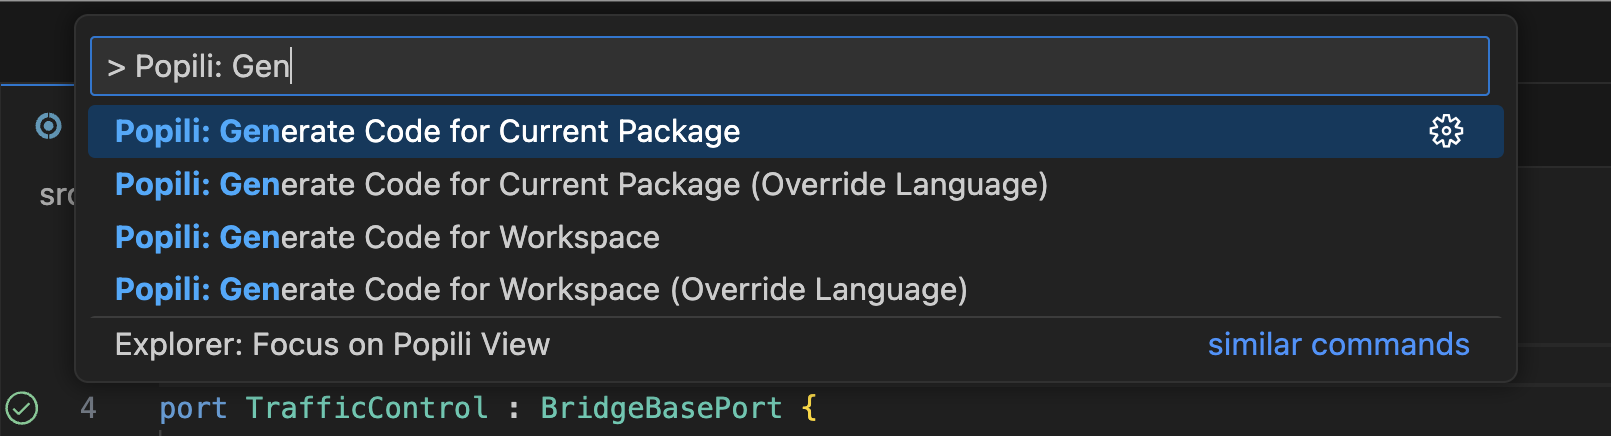
The code will be generated in the subfolder generated within your project. If the folder does not already exist, it will be automatically generated.
See also
For details on how to customise the code generated by Popili, see Packages and Code Generation Options.
Creating a Support Bundle
You can create an obfuscated ZIP file of a Coco project, for example to send to Cocotec support, where all proprietary information is removed, all identifiers are obfuscated, and all comments are removed.
To create a support bundle directly in VS Code, open the Command Palette and search for:
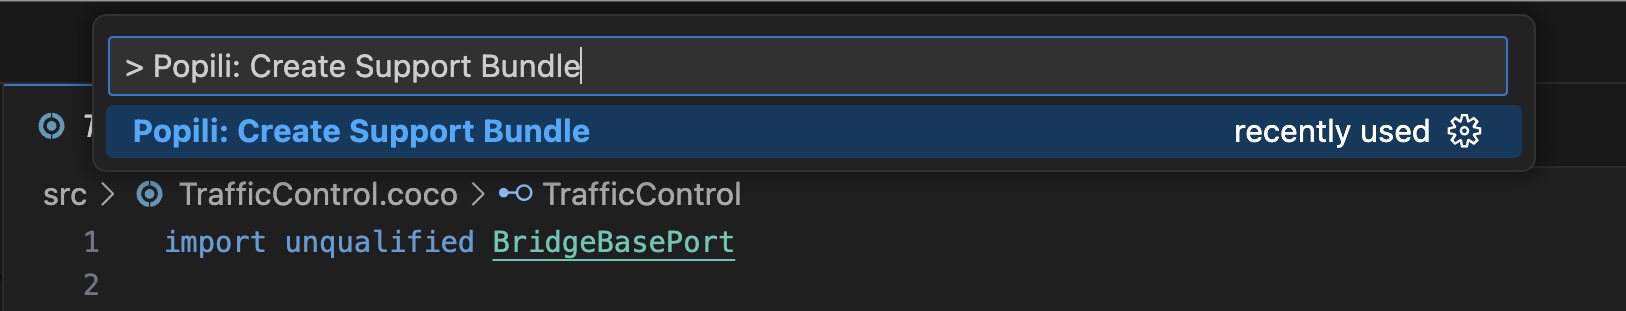
A popup window will appear, where you can save the generated support bundle as a ZIP file.
Getting Updates
For updates, simply go to VS Code Extensions, click on the Popili plugin and select from the options available.
Uninstalling Popili
To uninstall Popili in VS Code, simply go to VS Code Extensions, click on the Popili plugin and select Uninstall.