Debug Viewer
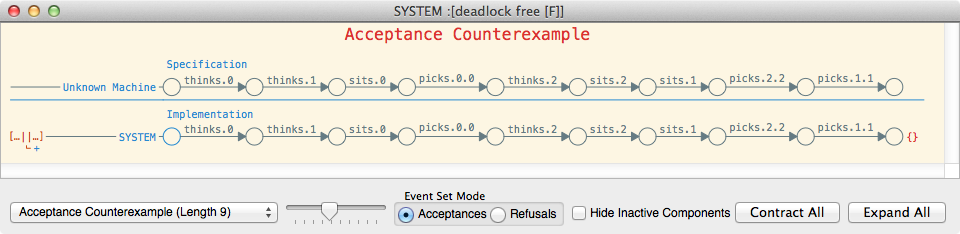
The debug viewer, as shown below, allows a counterexample to a refinement assertion to be viewed. In particular, it attempts to explain how the implementation evolved into a state where it could perform a behaviour that was prohibited by the specification. Conceptually, the debug viewer is a table where the rows represent behaviours of particular machines whilst the columns represent events that are synchronised.
The above counterexample, which we use as an example throughout this section, is
to the first assertion of an edited version of Dining Philosophers where
N = 3 (for ease of exposition).
Warning
Note that the counterexample that is displayed will be picked somewhat non-deterministically. See Counterexamples for further details.
Behaviours
The individual rows within the counterexample represent the behaviour of a machine. A behaviour of a particular machine is a sequence of states that the machine transitioned through, along with the events that it performed. In the default view of a counterexample, the first row represents the behaviour of the specification machine, whilst the second row represents the behaviour of the implementation.
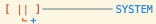
On the left of a behaviour row, two items of information are displayed, as shown to the right. The first is the operator that the machine represents, whilst the second is the name of the machine, if one was given to it in the script. Note that the operator is only displayed if the machine is a high-level or a compressed machine. Hovering over the operator will reveal the operator type and its arguments. For example, hovering over the operator in the image to the right displays the following.
Alphabetised parallel with process alphabets:
    1: {thinks.0, sits.0, eats.0, getsup.0, picks.0.0, picks.0.1,
        picks.2.0, putsdown.0.0, putsdown.0.1, putsdown.2.0}
    2: {thinks.1, sits.1, eats.1, getsup.1, picks.0.1, picks.1.1,
        picks.1.2, putsdown.0.1, putsdown.1.1, putsdown.1.2}
    3: {thinks.2, sits.2, eats.2, getsup.2, picks.1.2, picks.2.0,
        picks.2.2, putsdown.1.2, putsdown.2.0, putsdown.2.2}
which indicates that the operator in question is an alphabetised parallel operator with 3 processes, each of which has the corresponding alphabet.
Hovering over the machine name will display extra information in the right pane that includes the full
name (if it had to be abbreviated), a scrollable view of the trace (which is
particularly useful if the trace is long), and a textual representation of the
behaviour, if the row represents an error. For example, hovering over the
SYSTEM name in the above displays the following:
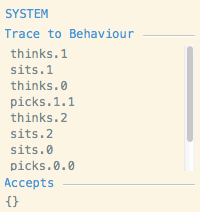
This indicates the trace that SYSTEM performed and the fact it accepted
{} at the end of trace, violating the specification.
The second component, which is the main section, shows the trace that this machine performed:

Each of the circles represents a state that the machine reaches. The edges
between the states are labelled by the events that the machine performs. Named
states are drawn in blue and, when hovering over a state, identical states of
the machine are highlighted in red. A dashed edge indicates that the machine
performed no event. Green edges indicate that the machine was restarted by the
event (e.g. consider P = X ; P).
Clicking on a state will reveal several items of information about it including: the state name (if any); the available events of the state; the minimal acceptances of the state. It also allows Probe to be launched to inspect the state’s transitions and, providing the machine does not have too many states, allows the Process Graph Viewer to be launched on the state. If the graph view is launched, then in addition to displaying the usual graph of the machine, the behaviour in the selected row will be highlighted (see Behaviours for more information).
Clicking on an edge will display several extra pieces of
information in the right pane. In particular, if the event is a tau that resulting from a hiding
it will reveal what the inner event is. Further, it will detail what events the
leaf processes perform in order to perform the overall event. For example,
hovering over the last event in the above counterexample (i.e. picks.1.1) in
the row labelled Implementation will display the following in the right pane:
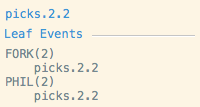
This indicates that FORK(2) and PHIL(2) both performed picks.2.2 in
order to produce the overall picks.2.2 event.
The third and rightmost component of a behaviour indicates how this machine contributes to the prohibited behaviour of the specification. For example, consider the following script:
channel a, b, c

Left = a -> c -> STOP
Right = a -> b -> STOP

Impl = Left[[c <- b]] [| {b} |] Right
Spec = a -> Spec

assert Spec [T= Impl
The above assertion will fail as Impl can perform the trace a, a, b,
which is not a trace of the specification. This results in the following
counterexample:
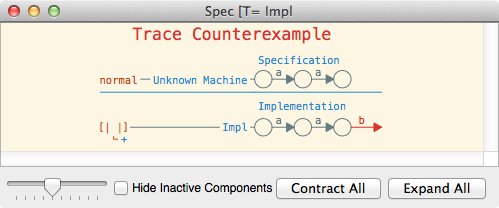
The rightmost component of the implementation behaviour indicates that the
process attempted to perform the event b, which was disallowed by the
specification (hence it is an error and is thus drawn in red).

Acceptance errors are indicated by giving the erroneous acceptance. Hence, in the above case, as shown to the right, the empty acceptance is shown as the machine deadlocks after the given trace. It is also possible to view maximal refusals rather than acceptances by selecting Refusals in the Event Set Mode in the bottom left hand corner of the debug viewer (as shown in the above case). The maximal refusals are relative to the set of events the machine in question can perform.
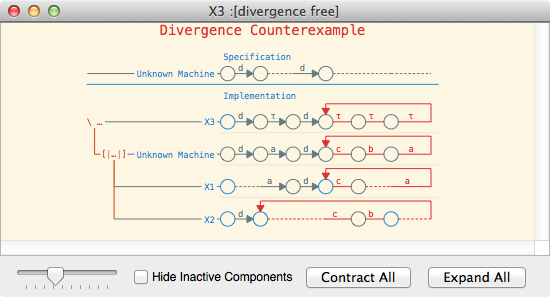
Divergence errors, or loop errors, are indicated by drawing the trace that
repeats in red. For example, in the above screenshot, the process X3 can
diverge by repeating a sequence of three taus, which actually is caused by a
machine repeating the trace c, b, a, which are then all hidden.

Divergence errors may also be indicated by simply stating that a given state
diverges, as indicated to the right. This occurs, for example, when checking
normal(div) (for a suitable definition of div) for livelock freedom.
For more information see Generalised Low-Level Machine.
Dividing Behaviours
If a behaviour is a behaviour of a high-level machine or a compressed machine then it may be divided into behaviours of its components. This can help significantly with working out either how a machine performed a particular event, or why the machine can perform the behaviour that was prohibited by the specification. A behaviour can be divided either by double clicking the operator of the machine, double clicking the plus button under the operator or double clicking any blank space in the middle section of the behaviour (i.e. the section with the states and events).
For example, consider the simple example script shown above. Clicking Expand All reveals the following:
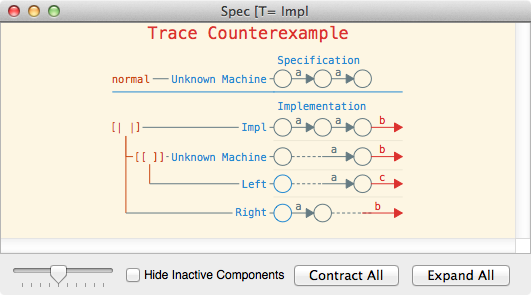
The left portion of the diagram shows the structure of the machines. In
particular, we can deduce that the implementation process (i.e. Impl) is a
parallel composition of Right and a renaming of Left (the operator
arguments can be viewed by hovering
over the operators themselves).
We can also deduce how the events synchronise together, as events in the same
column indicate that they are synchronised. Thus, in the above we can deduce
that the first a event occurred because Right performed an a, whilst
the second occurred because Left performed an a. In both cases we can
see that the event did not synchronise with any other event, due to the dashed
edges. The diagram also allows us to deduce why the b was performed. In
particular, the b must have occurred due to Right and the renamed copy
of Left synchronising on a b. Further, this was possible because
Left performed a c that was renamed to a b.