Session Window

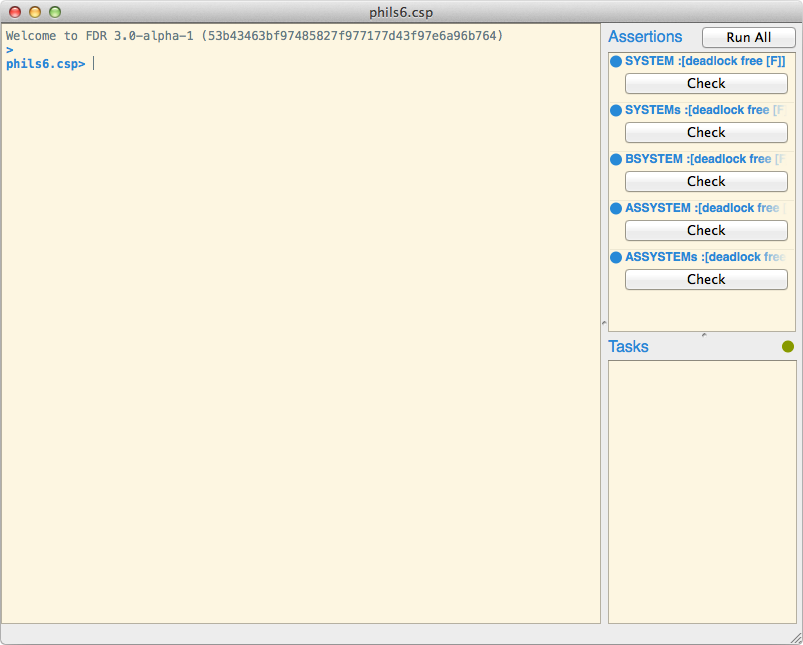
The main window of the GUI is the session window, and is illustrated above.
The session window provides the main interface to CSP files, and allows them to
be loaded (see load), expressions to be evaluated (see
Available Statements) and assertions run (see
The Assertion List). Below, we give an overview of the three main
components of the session window; the Interactive Prompt, the Assertion List and
the Task List.
The Interactive Prompt
The GUI is structured around an interactive prompt, in which expressions may be
evaluated, new definitions given, and assertions specified. For example, if FDR
was started with Dining Philosophers loaded (i.e. by typing fdr4
phils6.csp from a command prompt), then the following session is possible:
phils6.csp> head(<1..>)
1
phils6.csp> let f(x) = 24
phils6.csp> f(1)
24
phils6.csp> assert not PHIL(1) [F= PHIL(2)
Assertion 5 created (run using :run 5).
The command prompt also exposes a number of commands which are prefixed with :. For example,
the type of an expression can be pretty printed using :type:
phils6.csp> :type head
head :: (<a>) -> a
In addition, the command prompt has intelligent (at least in some sense) tab completion. For example:
phils6.csp> c<tab>
card    concat
phils6.csp> :<tab>
assertions  debug       graph       help        load        options
processes   quit        reload      run         type        version
The interactive prompt will also indicate when a file has been modified on disk,
but has not yet been reloaded, by suffixing the file name at the prompt with a
*.
Available Statements
Expressions can be evaluated by simply typing them in at the prompt. For
example, typing 1+1 would print 2. In order to create a new definition,
let can be used as follows:
phils6.csp> let f(x) = x + 1
phils6.csp> let (z, y) = (1, 2)
As with interactive prompts for other languages, each let statement overrides any previous definitions of the same variables, but does not change the version that previous definitions refer to. For example, consider the following:
phils6.csp> let f = 1
phils6.csp> let g = f
phils6.csp> let f(x) = g + x
phils6.csp> f(1)
2
In the above, even though f has been re-bound to a function, g still
refers to the previous version.
Transparent and external functions can be imported by
typing transparent x, y at the prompt:
phils6.csp> normal(STOP)
<interactive>:1:1-7:
    normal is not in scope
    Did you mean: normal (import using 'transparent normal')
phils6.csp> transparent normal
phils6.csp> normal(STOP)
...
New assertions can be created exactly as they would be in a CSP file, by typing
assert X [T= Y, or assert STOP :[deadlock free [F]]. For example:
phils6.csp> assert not PHIL(1) [F= PHIL(2)
Assertion 5 created (run using :run 5).
Available Commands
There are a number commands available at the command prompt that expose various
pieces of functionality. Note that all commands below may be abbreviated,
providing the abbreviation is unambiguous. For example, :assertions may be
abbreviated to :a, but :reload cannot be abbreviated to :r as this
could refer to :run.
-
command
:assertions¶ Lists all of the currently defined assertions. For example, assuming that Dining Philosophers is loaded:
phils6.csp> :assertions
0: SYSTEM :[deadlock free [F]]
1: SYSTEMs :[deadlock free [F]]
2: BSYSTEM :[deadlock free [F]]
3: ASSYSTEM :[deadlock free [F]]
4: ASSYSTEMs :[deadlock free [F]]
The index displayed on the left is the index that should be used for other commands that act on assertions (such as
debug).
-
command
:communication_graph <expression>¶ Given a CSP expression that evaluates to a process, displays the communication graph of the process, as per Communication Graph Viewer.
-
command
:counterexample <assertion index>¶ Assuming that the given assertion has been checked and fails, pretty prints a textual represenation of the counterexamples to the specified assertion.
-
command
:cd <directory name>¶ Changes the current directory that files are loaded from. This will affect subsequent calls to
load.
-
command
:debug <assertion index>¶ Assuming that the given assertion has been checked and fails, opens the Debug Viewer on the counterexample to the specified assertion.
-
command
:graph <model> <expression>¶ Given a CSP expression that evaluates to a process, displays a graph of the process in the Process Graph Viewer. By default, the process will be compiled in the failures-divergences model but a specific model can be specified, for example, by typing
:graph [Model] P, where the model is specified as per assertions. For example,:graph [F] Pwill cause the failures model to be used.
-
command
:help¶ Displays the list of available commands and gives a short description for each.
-
command
:help <command name> Displays more verbose help about the given command, which should be given without a
:. For example:help typedisplays the help about thetypecommand.
-
command
:load <file name>¶ Loads the specified file, discarding any definitions or assertions that were given at the prompt.
-
command
:options¶ See
options list.
-
command
:options get <option>¶ Displays the current value for the specified option.
-
command
:options help <option>¶ Displays a brief description about the specified option, along with details on the range of permitted values.
-
command
:options list¶ Lists all available program options and prints a brief description and the current value for each option. See Options for details on the available options.
-
command
:options reset <option>¶ Resets the specified option to the default value.
-
command
:options set <option> <value>¶ Sets the specified option to the given value, displaying an error if the value is not permitted.
-
command
:probe <expression>¶ Given a CSP expression that evaluates to a process, explores the transitions of the process using Probe.
-
command
:processes¶ Lists all currently defined processes, including functions that evaluate to processes.
-
command
:processes false¶ Lists all currently defined processes but, in contrast to
processes, does not include functions that evaluate to processes.
-
command
:profiling_data¶ If
cspm.profiling.activeis set toOnand the current file has been loaded/reloaded since this option was activated, this will display profiling data about every function that has been executed since the file was loaded. For example, suppose the following sequence of commands had been executed at the prompt:phils6.csp> :option set cspm.evaulator.profiling On phils6.csp> :run 0 phils6.csp> :profiling_data
Then any profiling data that was generated by executing the first assertion (which would include any function calls made by any function executed as part of the first assertion) in the file would be displayed.
For an explanation of the output format see Profiling.
-
command
:quit¶ Closes FDR.
-
command
:reload¶ If no file is currently loaded then this resets the current session to a blank session, discarding any definitions or assertions that were given at the prompt. Otherwise, if a file is loaded, then this loads a fresh copy of the file, again discarding any definitions or assertions that had been given at the prompt.
-
command
:run <assertion index>¶ Runs the given assertion. This consists of two phases; in the first phase the specification and implementation of the given assertion are compiled into state machines whilst in the second phase the assertion itself is checked. Presently, no further commands may be evaluated until the first phase has completed.
-
command
:statistics <assertion index>¶ Assuming the given assertion is either running or has already completed, this displays various statistics relating to the assertion including: the number of states visited, the number of transitions visited, the amount of time required to complete the check, and the amount of memory used.
-
command
:structure <expression>¶ Given a CSP expression that evaluates to a process, displays the compiled structure of the process, as per Machine Structure Viewer.
-
command
:type <expression>¶ Prints the type of the given CSP expression. For example,
:type STOPprintsSTOP :: Proc.
-
command
:version¶ Displays the full version number of the currently running FDR.
The Assertion List

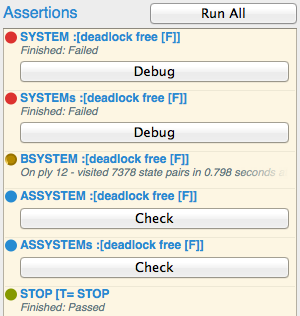
The top-right of the session window, illustrated to the right, displays the list of assertions that have been defined. This includes all assertions defined in the source file, together with all of those defined in the session, in the order of definition. An assertion may be run by clicking the appropriate Check button. Alternatively, the Run All button may be clicked, which will run all of the un-checked assertions, in parallel. If an assertion has been run and fails, the Debug button may be pressed, which will launch the Debug Viewer.
Whilst an assertion is being checked, the progress of the check is displayed inline, just below the title of the assertion. The status of the assertion is indicated by the small circle next to the title of each assertion. The colours indicate the following:
- Blue
- The assertion has not yet been run.
- Yellow
- The assertion is currently being checked.
- Red
- The assertion has been checked and has failed.
- Green
- The assertion has been checked and passed.
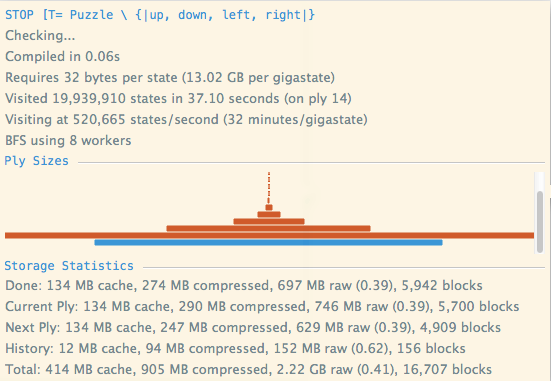
Clicking the info button (with a question mark) on an individual assertion displays a window that with various performance statistics about the refinement check. For example:

This window displays, in descending order of display:
- Compilation Time
- The time taken to compile the assertion.
- Storage Requirements
- The number of uncompressed bytes to store each node pair encountered during the check. The total amount of storage required is therefore proportional to the number of visited states times this figure, multiplied by the average achieved compression ratio (see below).
- Visited States
- The number of states visited, and the current ply of the breadth-first search.
- Number of Workers
- The number of workers used in the parallel breadth-first search (this can
be configured using
refinement.bfs.workers). - Ply Sizes
- The relative size of each of the plys in the breadth-first search is indicated by the width of the bars. The absolute size of a ply can be viewed by hovering over a particular ply in the search. The current ply of the search is drawn in blue.
- Storage Statistics
The total amount of memory, allocated for each type of block-level storage in the search. The cache figure is the amount of memory used to store uncompressed blocks in memory. Compressed refers to the amount of memory allocated for storing compressed blocks whilst raw indicates the amount of memory that would have been required to store the blocks uncompressed. Finally, the achieved compression ratio is given.
Storage statistics are provided for each of the main block stores. Done is the store used to store blocks used by the set of visited states. Current level is the store used to store blocks used by the set of states to visit on the current ply of the search. Next level is the store used to store block that will be visited on the next ply whilst history is the store used to store blocks that indicate how node pairs were reached (for purposes of counterexample reconstruction). Blocks is the number of memory blocks allocated to store data (note that they are of a fixed size). Total is simply the sum of the above figures.
Thus, the total amount of block-level storage required is equal to the total cache size plus the total size of the compressed store (although this will not include the cost to store state machines and other miscellaneous data structures).
For more information on what these statistics represent see Compilation and Refinement Checking.
The Task List

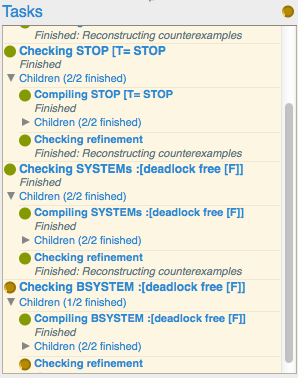
The bottom-right of the session window, illustrated to the right, displays the list of tasks that are currently running. A task is any long-running job performed by the GUI, and includes items like checking refinements, graphing processes or evaluating expressions. The list of tasks is hierarchical, allowing the dependencies between tasks to be tracked. For example, if a task is a Checking Refinement task, then the task will have two children; a compiling task and a checking refinement task (see Compilation for more details about tasks during compilation).
The status of each task, if available, is displayed inline, below the task title. Any child tasks of the parent are displayed below the status, in a section that can be expanded or contracted by clicking the triangle. The circular indicator next to the task title indicates the task status; if it is yellow then the task is running, green indicates that the task completed successfully whilst red indicates that the task fails. Hovering over the circular indicator will display the runtime of the task.