Node Inspector
When debugging a counterexample or when using probe, FDR allows an individual
node (i.e. state) to be inspected in order to allow the actual structure of the
node to be understood. The node inspector can be launched on any state in
Probe by selecting a row, right-clicking and then selecting Inspect
Node in the resulting menu. To launch the node inspector from the
Debug Viewer, hover over the desired state and select Inspect Node
in the window that appears. For example, suppose the counterexample shown as part of the Debug Viewer is
being viewed and that the very first node of the implementation row is hovered
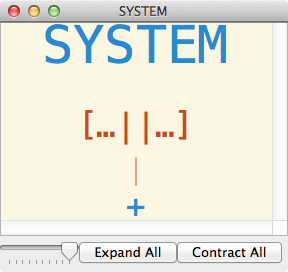
over (i.e. the blue node on the SYSTEM line). Clicking Node Inspector in
the resulting window will result in the following being displayed:

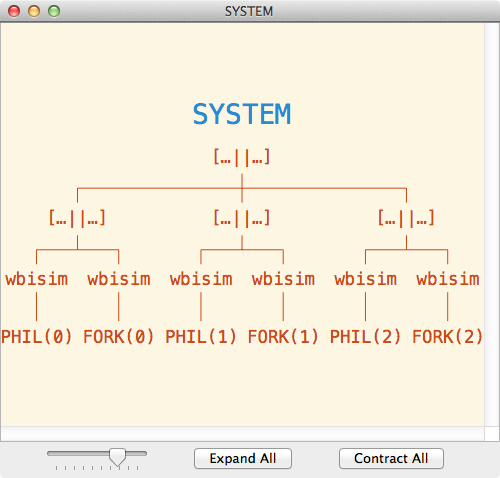
Clicking on Expand All will result in the full node structure of the selected node being displayed, as shown below:

The above indicates that the selected node is an alphabetised parallel of three
alphabetised parallels, the first of which is a parallel of the weak
bisimulation of PHIL(0) and the weak bisimulation of FORK(0). Hovering
over the nodes in the window will display information various information, such
as the synchronisation sets in use. Unknown nodes are indicated using a ?.
Note that hovering over the node will reveal some information about it, such as
which state machine the node is a member of (if known).