Process Graph Viewer
FDR is also capable of displaying graphs of processes, rendered using GraphViz. This can be very useful for visualising small processes, but once the graph grows beyond a few hundred states or transitions, it quickly becomes unmanageable (and can cause GraphViz to consume vast amounts of memory).
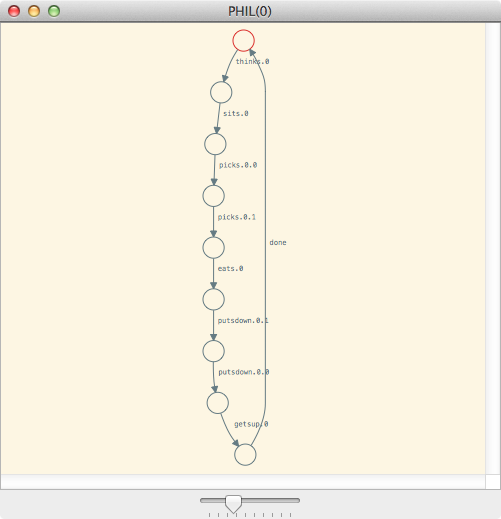
For example, if Dining Philosophers is loaded, then typing :graph
PHIL(0) into the prompt will display the
following window:

The graph is rendered in the obvious way. Each state of a process is rendered as a circular node, whilst the transitions are drawn as labelled edges. The initial node of the machine is drawn in red, whilst named nodes are drawn in blue (i.e. if a node corresponds to a named process). Clicking on a node will, as with the Debug Viewer, display some information about the node in the right-hand pane, including the available events, its minimal acceptances, and the node name, if one is available. It also allows Probe to be launched from the selected state.
The graph can be navigated exactly like the Debug Viewer. Thus, it can be panned (or moved) by clicking and dragging whilst scrolling will zoom in or out. Double clicking will zoom in by a constant amount. Alternatively, if gestures are supported, zooming can be accomplished by pinching (as on a touch screen device) and panning is instead done by scrolling. In either case, the zoom level can be modified by moving the slider at the bottom.
Behaviours
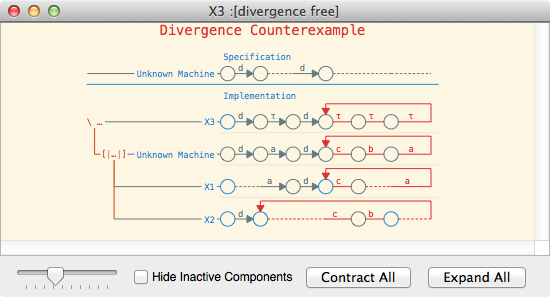
If the process graph viewer is launched on a machine or a node from within the debug viewer, then the selected behaviour is highlighted on the graph. For example, suppose the following counterexample is being viewed in the debug viewer:

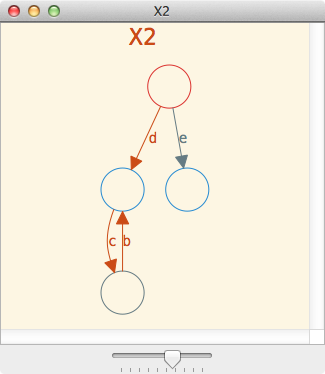
Clicking on View Graph in the right pane will display the following graph:

In the above, each transition that formed part of the behaviour of X2 is
highlighted. Hence, the d transition to the c, b loop is
highlighted, since this is the behaviour that is being displayed in the debug
viewer. In addition, hovering over the machine name will display a textual
description of the behaviour. For example, in the above window hovering over
X2 will display the following text:
Highlighting the behaviour:
    X2 (Repeat Behaviour):
        Trace: <d>
        Repeats the trace: <c, b>