Probe
Probe can be used to manually explore the transitions of a process as a tree,
which can be very helpful when debugging a process definition. Probe can be
launched on any process by typing :probe P into the
prompt. Alternatively, Probe may be launched
on any state via a node (such as those in the Debug Viewer or
Process Graph Viewer) by clicking the Probe button.
As an example of how to use Probe, consider loading Dining Philosophers
and typing :probe SYSTEM into the prompt; this will result in the following
window being displayed:
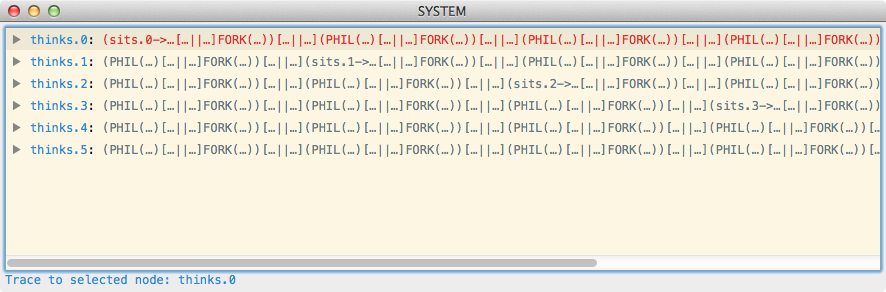
In the above, the transitions of the initial state (i.e. SYSTEM) are shown
in sorted order of event. A line of the form ev: P means that the process
can perform the event ev and evolve into the process P. Further, each of
these lines can be expanded to reveal the transitions of the resulting process,
yielding a tree of transitions. To expand the transitions of a process either
double click on the row, click on the triangle to the left of the row, or use
the right arrow keyboard button. To contract a row, either double click on the
row, click on the triangle or use the left arrow keyboard button.
For example, if we expand the first and the second rows, we see the following view:
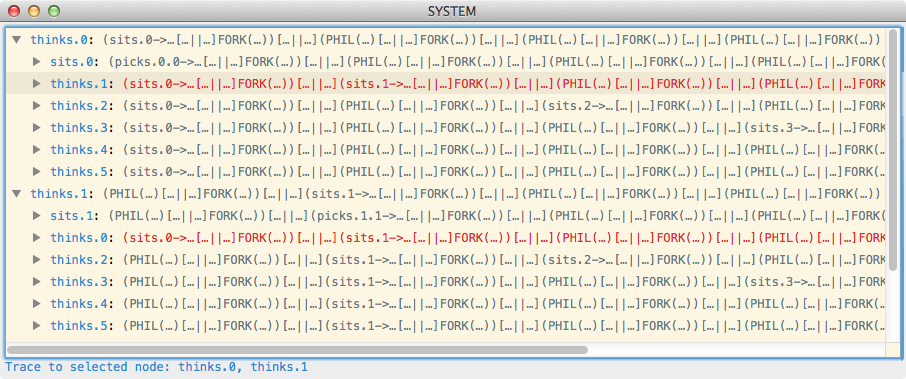
Probe also highlights syntactically equivalent nodes in red. For example, in the
above screenshot there are two rows highlighted as the state reached by
SYSTEM performing thinks.0 and then thinks.1 is identical to the
state reached by performing the events in the opposite order.
The trace required to reach the currently selected node is displayed at the bottom of the window.