Eclipse
This section presents an overview of the different features provided by Popili in Eclipse, and steps through how to use them effectively. We assume that you have Popili installed, and that you are able to create projects and Coco modules. If you need any help with this, then follow the step-by-step guide provided in Getting Started.
Popili Perspective
After installing Popili in Eclipse, the Popili Perspective should be set as the default one when Eclipse opens. It can also be opened in any of the following ways:
- Click the Open Perspective button in the tool bar, and select Popili from the popup list.
- Select Window → Perspective → Open Perspective → Other… → Popili in the Eclipse menu, and click Open.
By default, the Popili perspective consists of the following views:
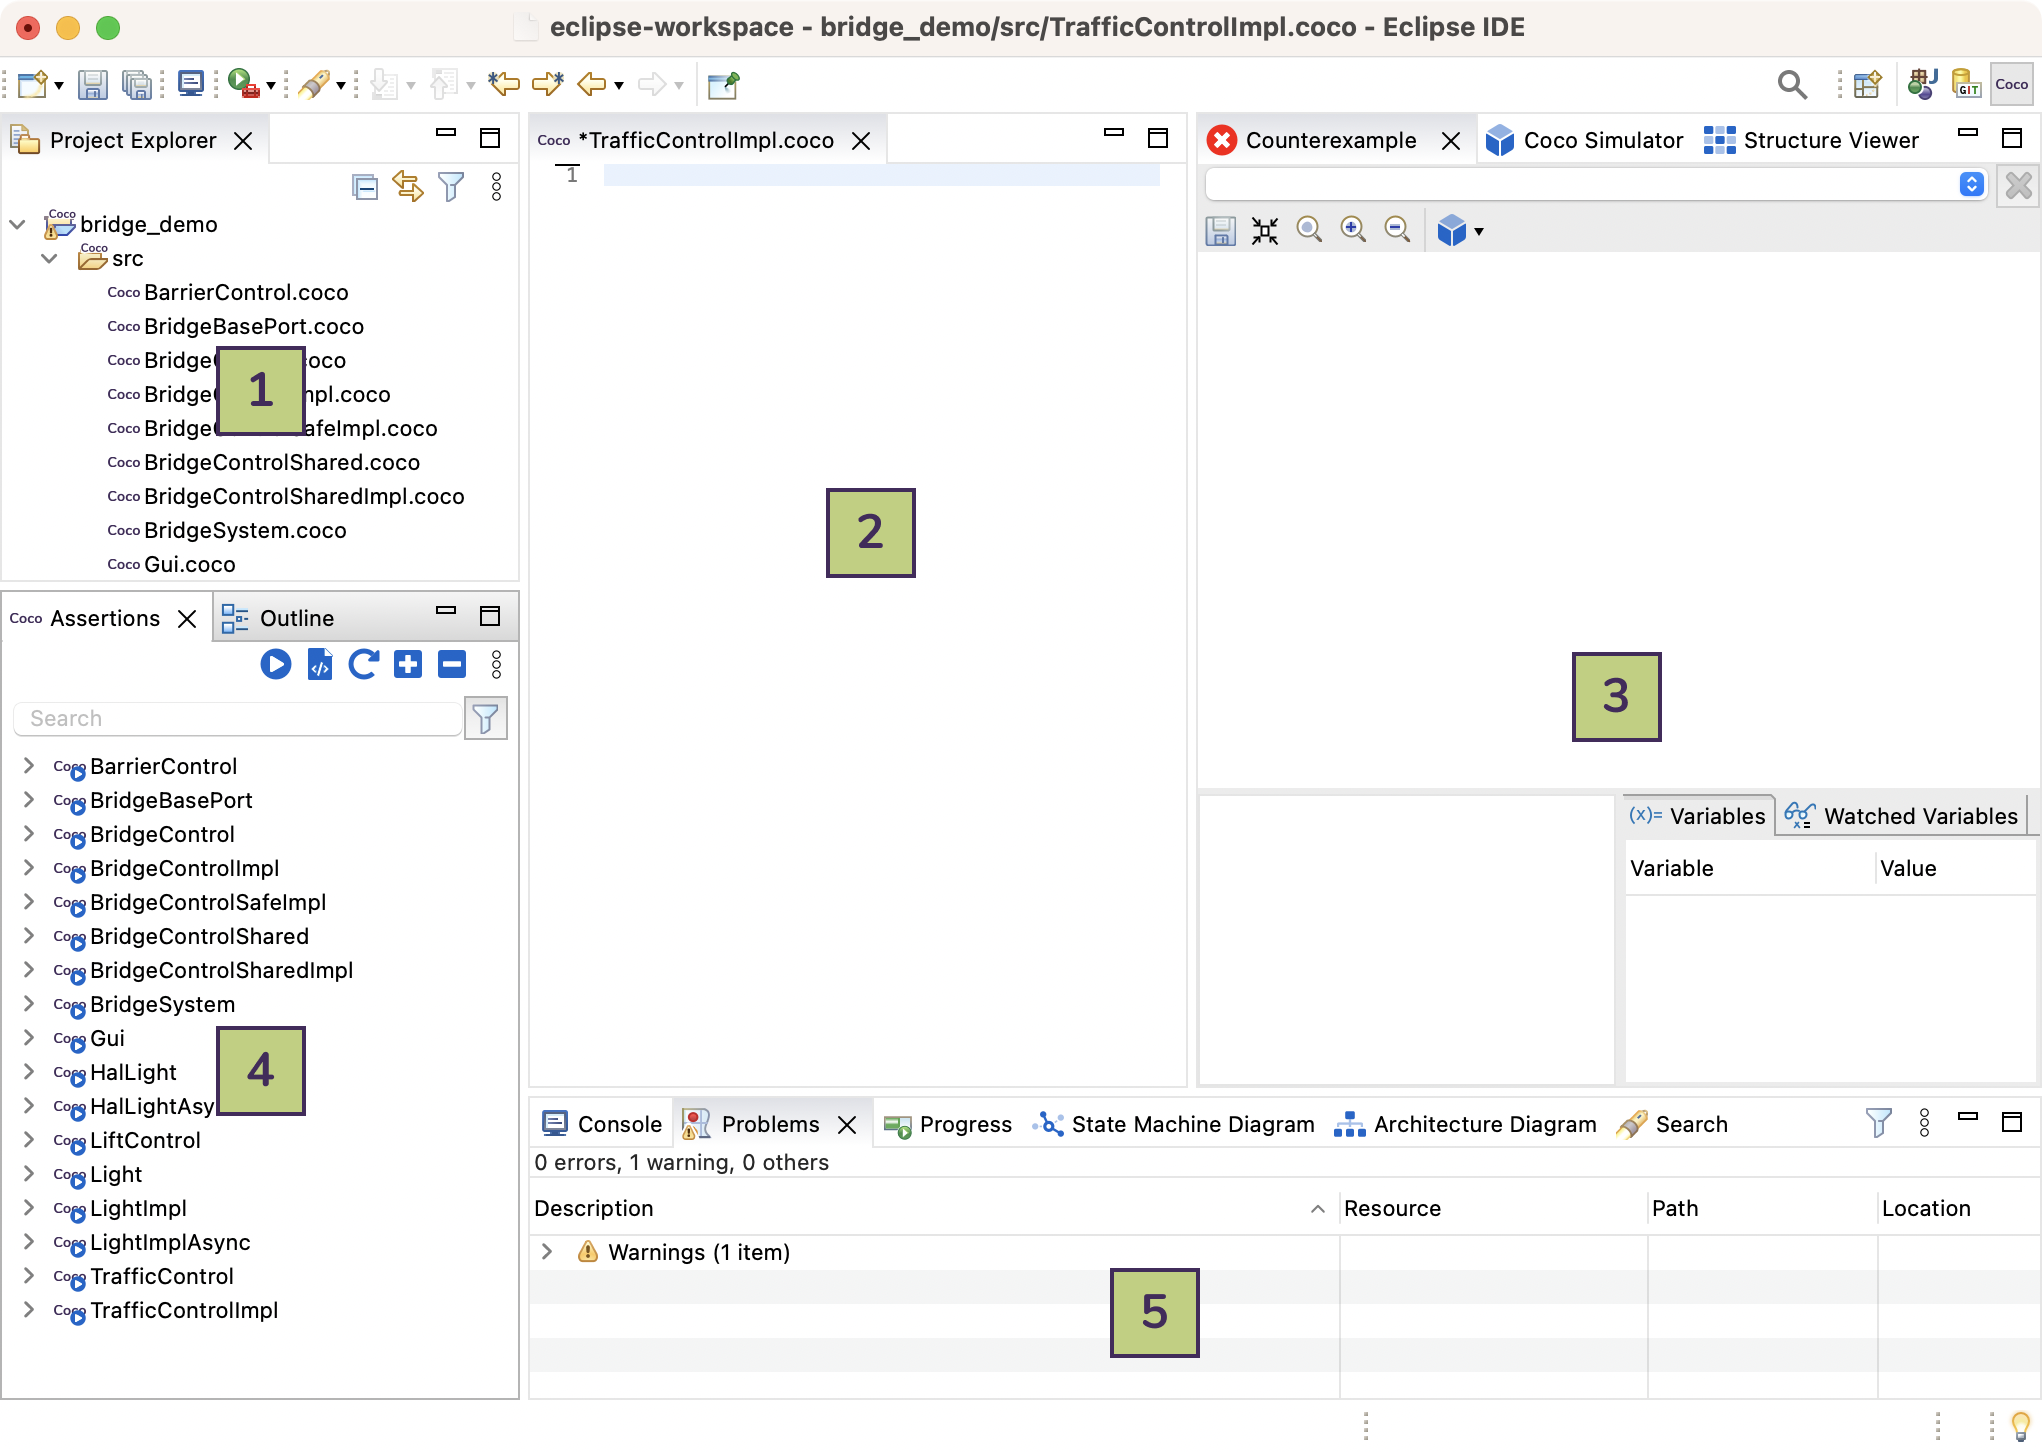
Each view numbered above has the following functionality:
The Project Explorer view is where Coco projects, modules, and the generated code files are created, opened, closed, renamed, and deleted.
The Coco Editor views are where Coco modules are edited.
This area has the following views:
- Counterexamples view displays extensive debugging information for the verification errors and warnings found by Popili.
- Simulator view is where you can drive the Popili simulator to interactively explore port and component state machines, and counterexamples.
- Structure Viewer view displays a structured view for port and component state machines, summarising which events are allowed in which states.
This area has the following views:
- Assertions view displays the list of assertions to be verified, and their verification status.
- Outline view displays the structure of the Coco module displayed in the currently selected editor view.
Both views can be independently linked to the Coco Editor.
This area has the following views:
- Console view displays console output.
- Problems view displays messages for errors and warnings in the Coco modules.
- Progress view displays the verification progress.
- State Machine Diagram view displays a graphical representation of Coco state machines.
- Architecture Diagram view displays a graphical representation of Coco architectures.
Popili Preferences
The are a number of Popili-specific preferences, which can be viewed and modified in the usual way by selecting Eclipse → Preferences → Popili, and clicking on one of the following options:
- Coco Editor:
- Save Actions: when selected, the Coco code is automatically formatted whenever it is saved.
- Typing: provides a range of editing preferences.
- Logs: allows you to select whether crash reports are automatically submitted to Cocotec.
- Source Path: specifies the build path entries used as the default when creating new Coco projects.
- Verification: allows you to control whether the verification is run remotely or locally:
- Disabled: the verification is always performed locally.
- Enabled: the verification is performed by the remote verification service by default. If the service is not available, then the verification is performed locally.
- Enabled (remote when available): the verification is performed by the remote verification service by default. If the service is not available, then the verification is performed locally.
- Enabled (remote only): the verification is always run by the remote verification service. If the service is not available, then verification cannot be performed.
Coco Packages
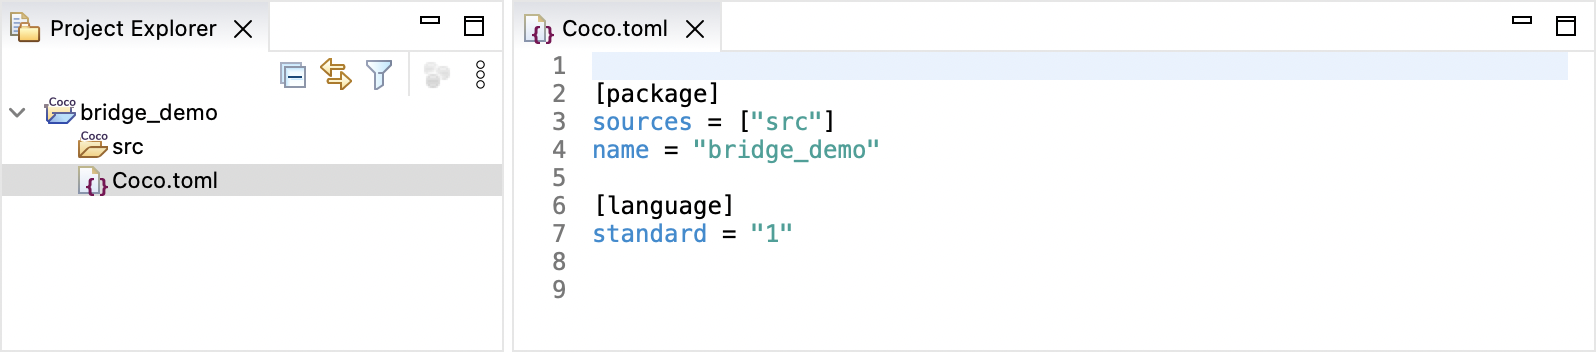
A Coco project is simply a normal Eclipse project with a Coco package called Coco.toml,
which contains the Coco-related configuration settings for your project. When you
create a new Coco project in Eclipse, a Coco package called
Coco.toml is automatically created at the top level of your project directory containing the package name,
location of the Coco source files, and the Coco version. This is illustrated in the following example of a newly
created Coco project called bridge_demo:
You can extend the Coco.toml file with additional configuration settings as described in the Packages and Workspaces section.
When using Coco in Eclipse, there is a one-to-one relationship between a project and a package: every project must have its own Coco package, and their names must be the same. If there are any dependencies between the Coco packages, then all of the corresponding projects have to be loaded into the Eclipse workspace.
Coco Editor
Popili provides a custom editor that supports a number of essential features for efficiently writing programs in Coco. The first of these is semantically-aware code completion, which provides a sorted list of options that has been with the most likely choices you are seeking at the top of the list. This runs automatically as you type, and you can also invoke this by using the keyboard shortcut Ctrl+Space.
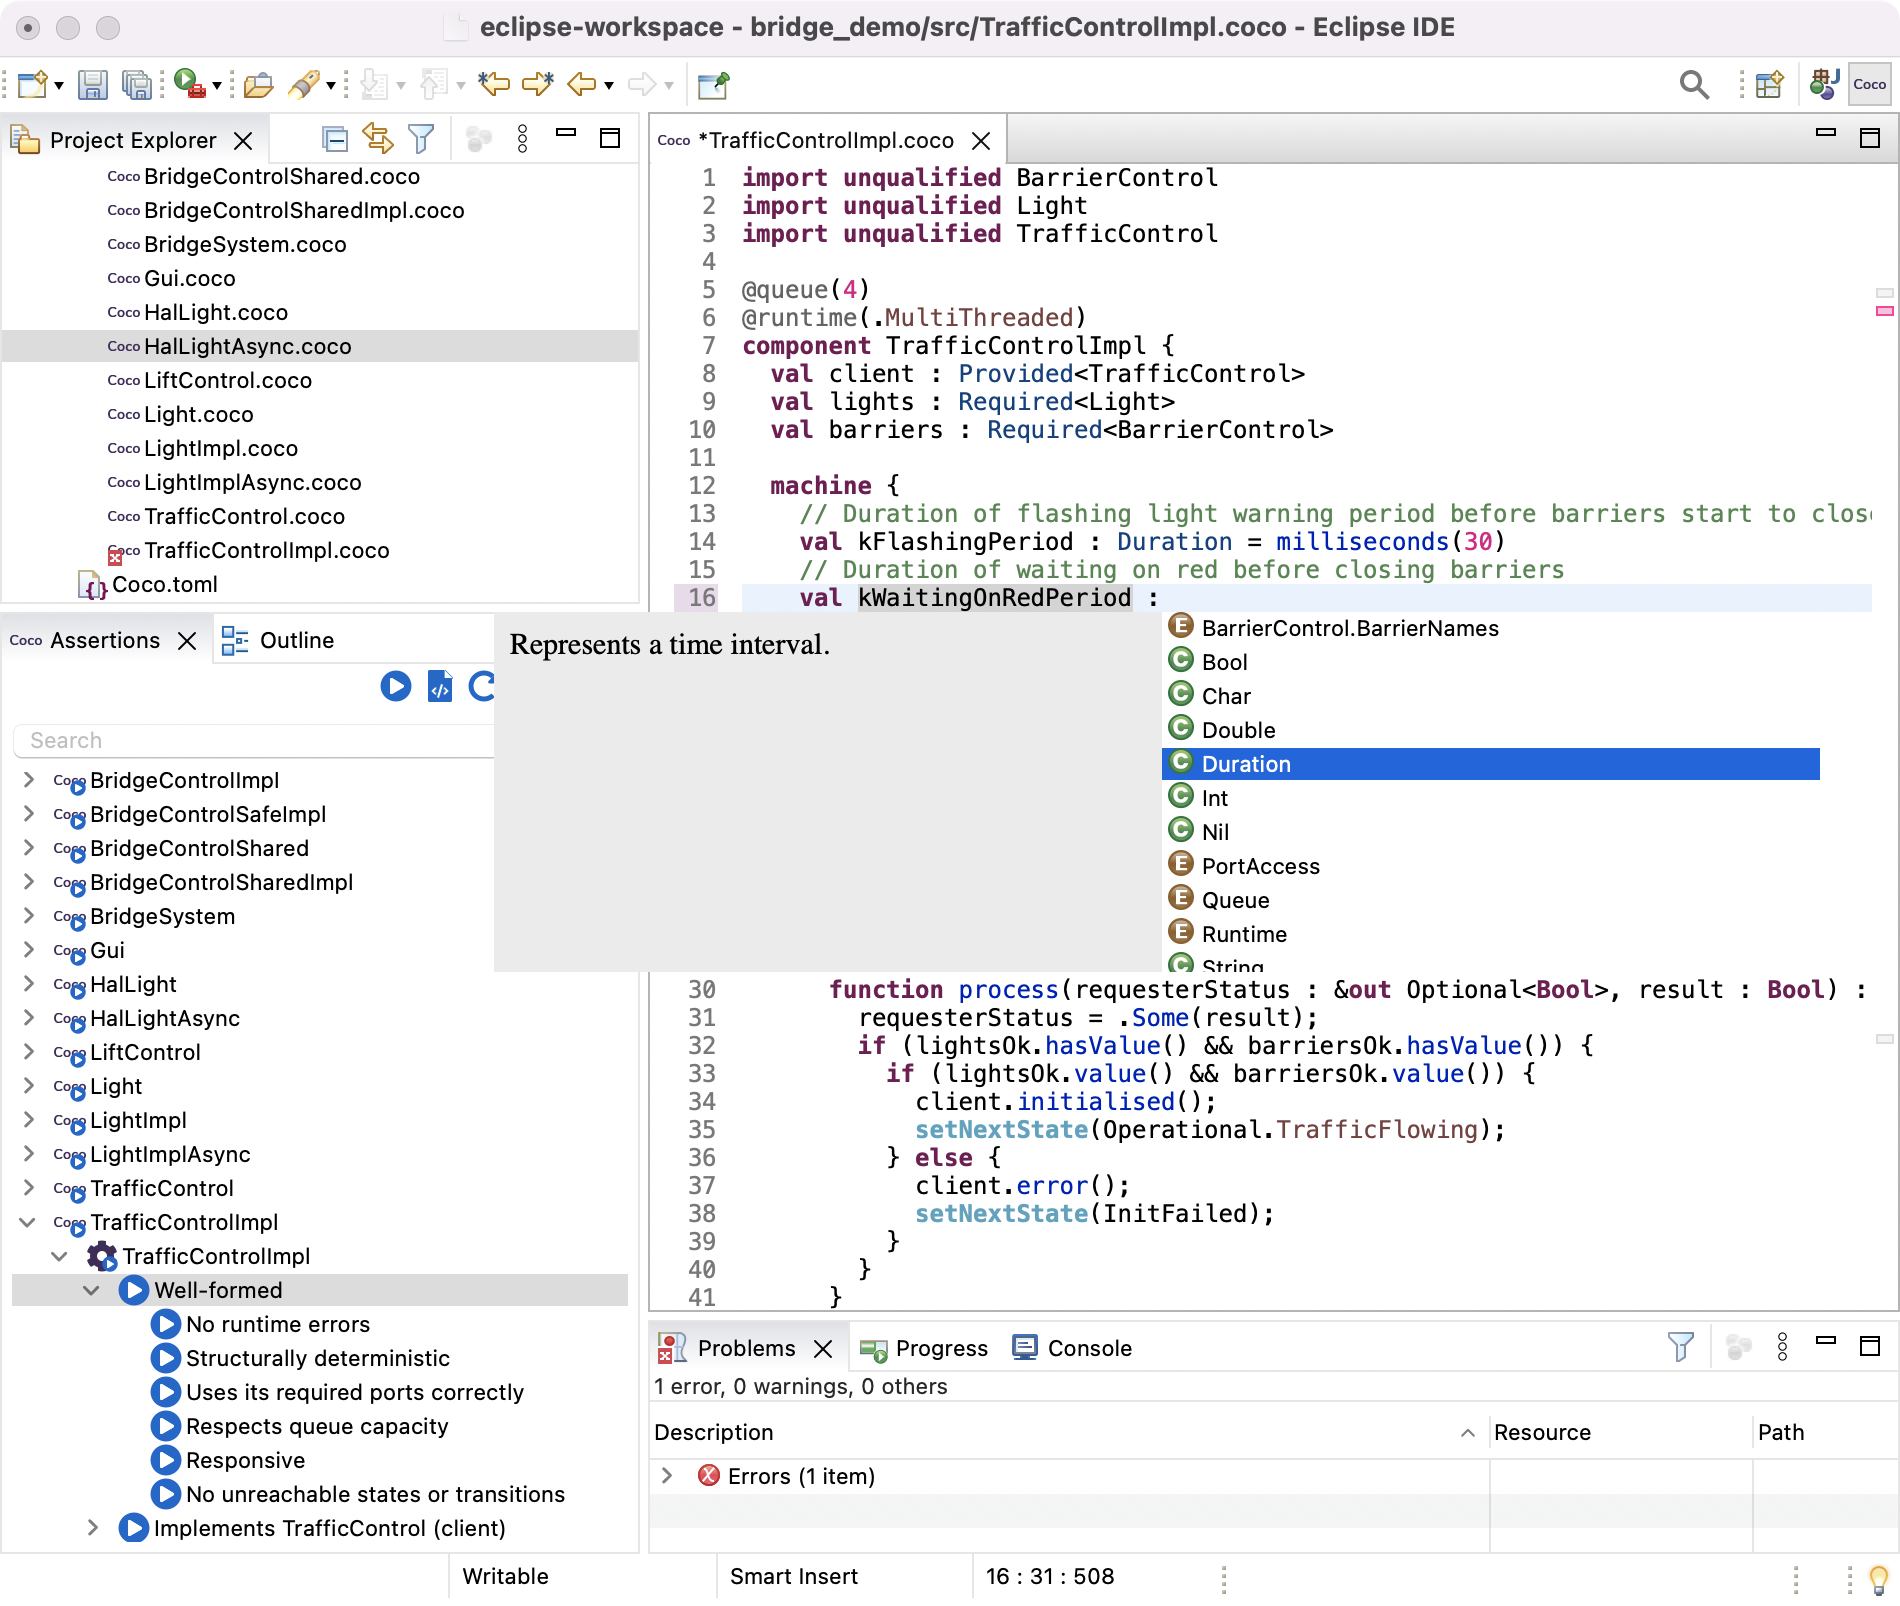
The editor performs continuous syntax and type checking as you type. By default, errors are highlighted by underlining the relevant code in red, and displaying an error icon next to the corresponding line number. Clicking on this icon displays a tooltip describing the error, which is also displayed in the Problems view.
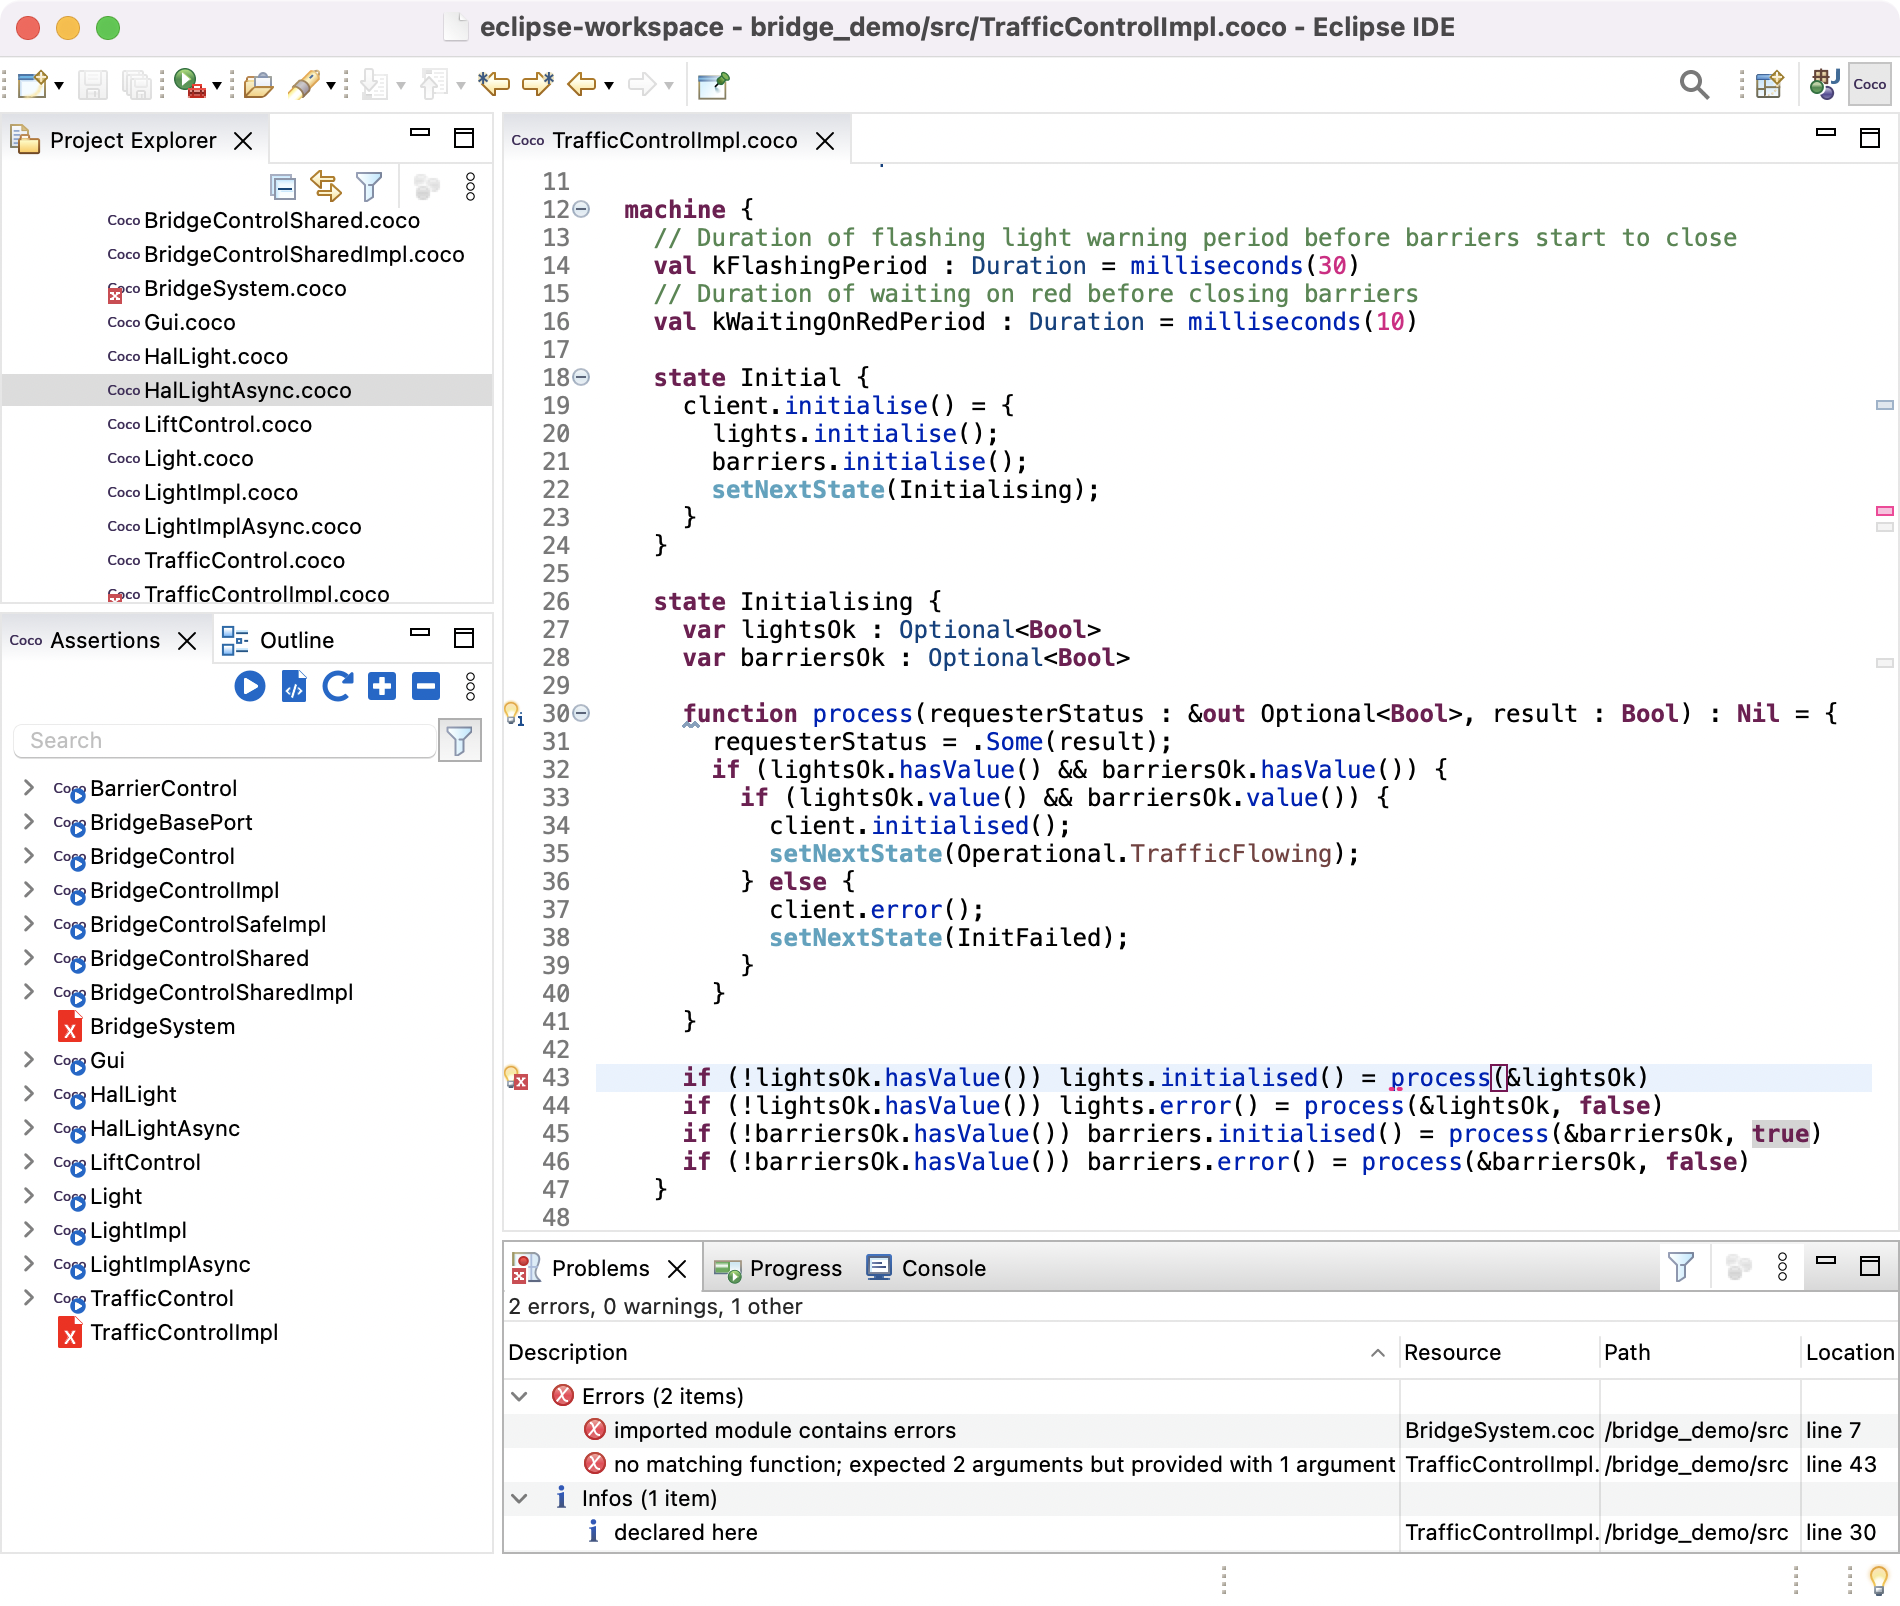
The editor also raises warnings about your code, such as identifying variables that are unused. By default, the relevant code is underlined in yellow, and a warning icon is displayed next to the corresponding line number. Clicking on the icon displays a tooltip describing the warning, which is also displayed in the Problems view.
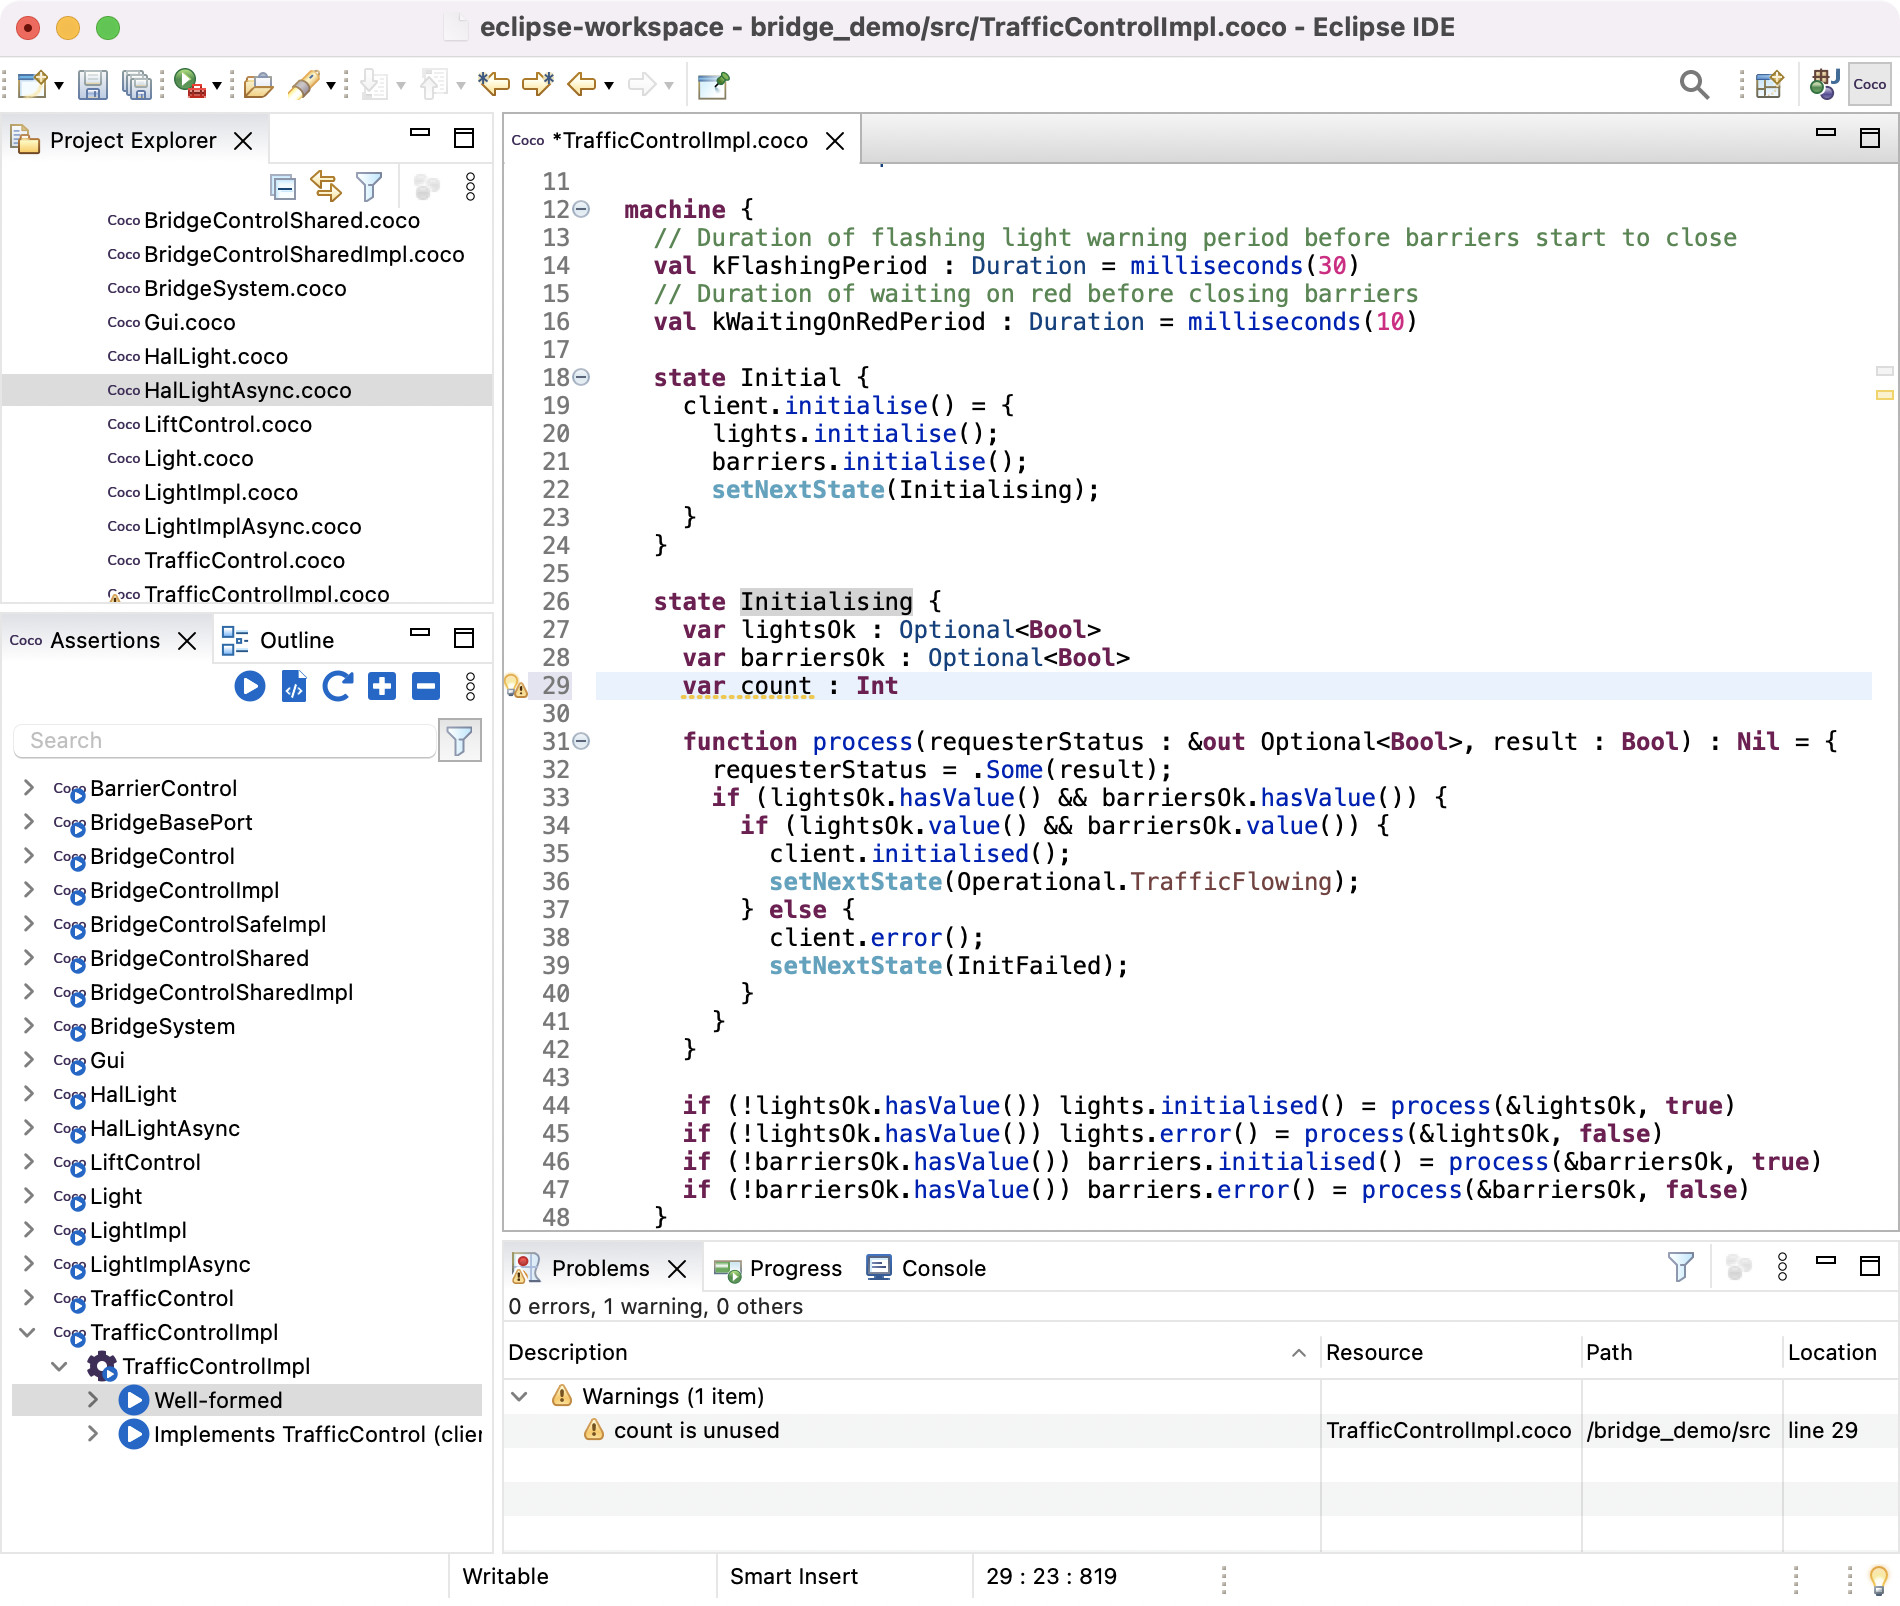
Popili will offer suggestions on how to solve errors and warnings where possible. You can apply these suggestions by double-clicking on an error or warning message in the Problems View, and invoking the Eclipse Quick Fix feature in the usual way by using the keyboard shortcut Cmd+1 on macOS, or Ctrl+1 on Linux/Windows.
By default, the Coco editor automatically formats your code upon every save of the Coco module. This setting can be customised in the Popili Preferences. You can also invoke the formatter at any time using the keyboard shortcut Cmd+Shift+F on macOS, or Ctrl+Shift+F on Linux/Windows. The format applied to a Coco project can be controlled by the formatting policy setting in the project’s Package File.
In addition to the keyboard shortcuts mentioned above, the Coco editor also has the following shortcut for commenting and uncommenting code: Cmd+/ for macOS, and Ctrl+/ for Linux/Windows.
Verifying Coco
Popili formally verifies Coco components and ports for a broad range of properties, ranging from runtime errors through to advanced liveness properties. A detailed overview of all the properties verified can be found in the Coco Language Reference. This section steps through how to run the verification, and understand the results.
Assertions View
The Assertions view displays all of the properties that can be verified for components and ports, and has the following buttons in its toolbar:
| Icon | Meaning |
|---|---|

|
Runs the verification for all of the assertions listed in the Assertions view. If you hover your cursor over this icon, then you will see a tooltip appear highlighting this. |

|
Generates the code in the subfolder generated within your project. If the folder does not already exist, it will be automatically generated. |

|
Forces the project to be reloaded from disk. |

|
Expands the top-level assertions to reveal the next level in the assertion hierarchy. |

|
Contracts the hierarchy of assertions back to listing the top level of assertions only. |

|
This can be selected by clicking the View Menu icon (denoted by three grey dots), and links the Assertions view with the Coco Editor views, so that the corresponding assertions are displayed for a Coco module selected in the editor. |
The assertions are arranged hierarchically for each Coco project. When a Coco project is open and selected in the Project Explorer view, all of the Coco modules in the project are displayed in the Assertions view. Expanding a module assertion reveals the ports and components within that module. If a Coco module has unresolved syntax or type errors in it, then the corresponding assertion is labelled with an error icon, and cannot be expanded. Expanding a component or port assertion reveals the individual groups of properties to be verified in each case.
An assertion can be expanded or contracted either by clicking on the grey arrow in front of its name, or by clicking on the corresponding icons in the Assertions view’s toolbar.
Each assertion is denoted by one of the following icons representing what kind of item it is:
| Icon | Meaning |
|---|---|

|
Folder |

|
Coco module |

|
Implementation component |

|
Encapsulating component |

|
External component |

|
Port |

|
assert declaration for a trace |
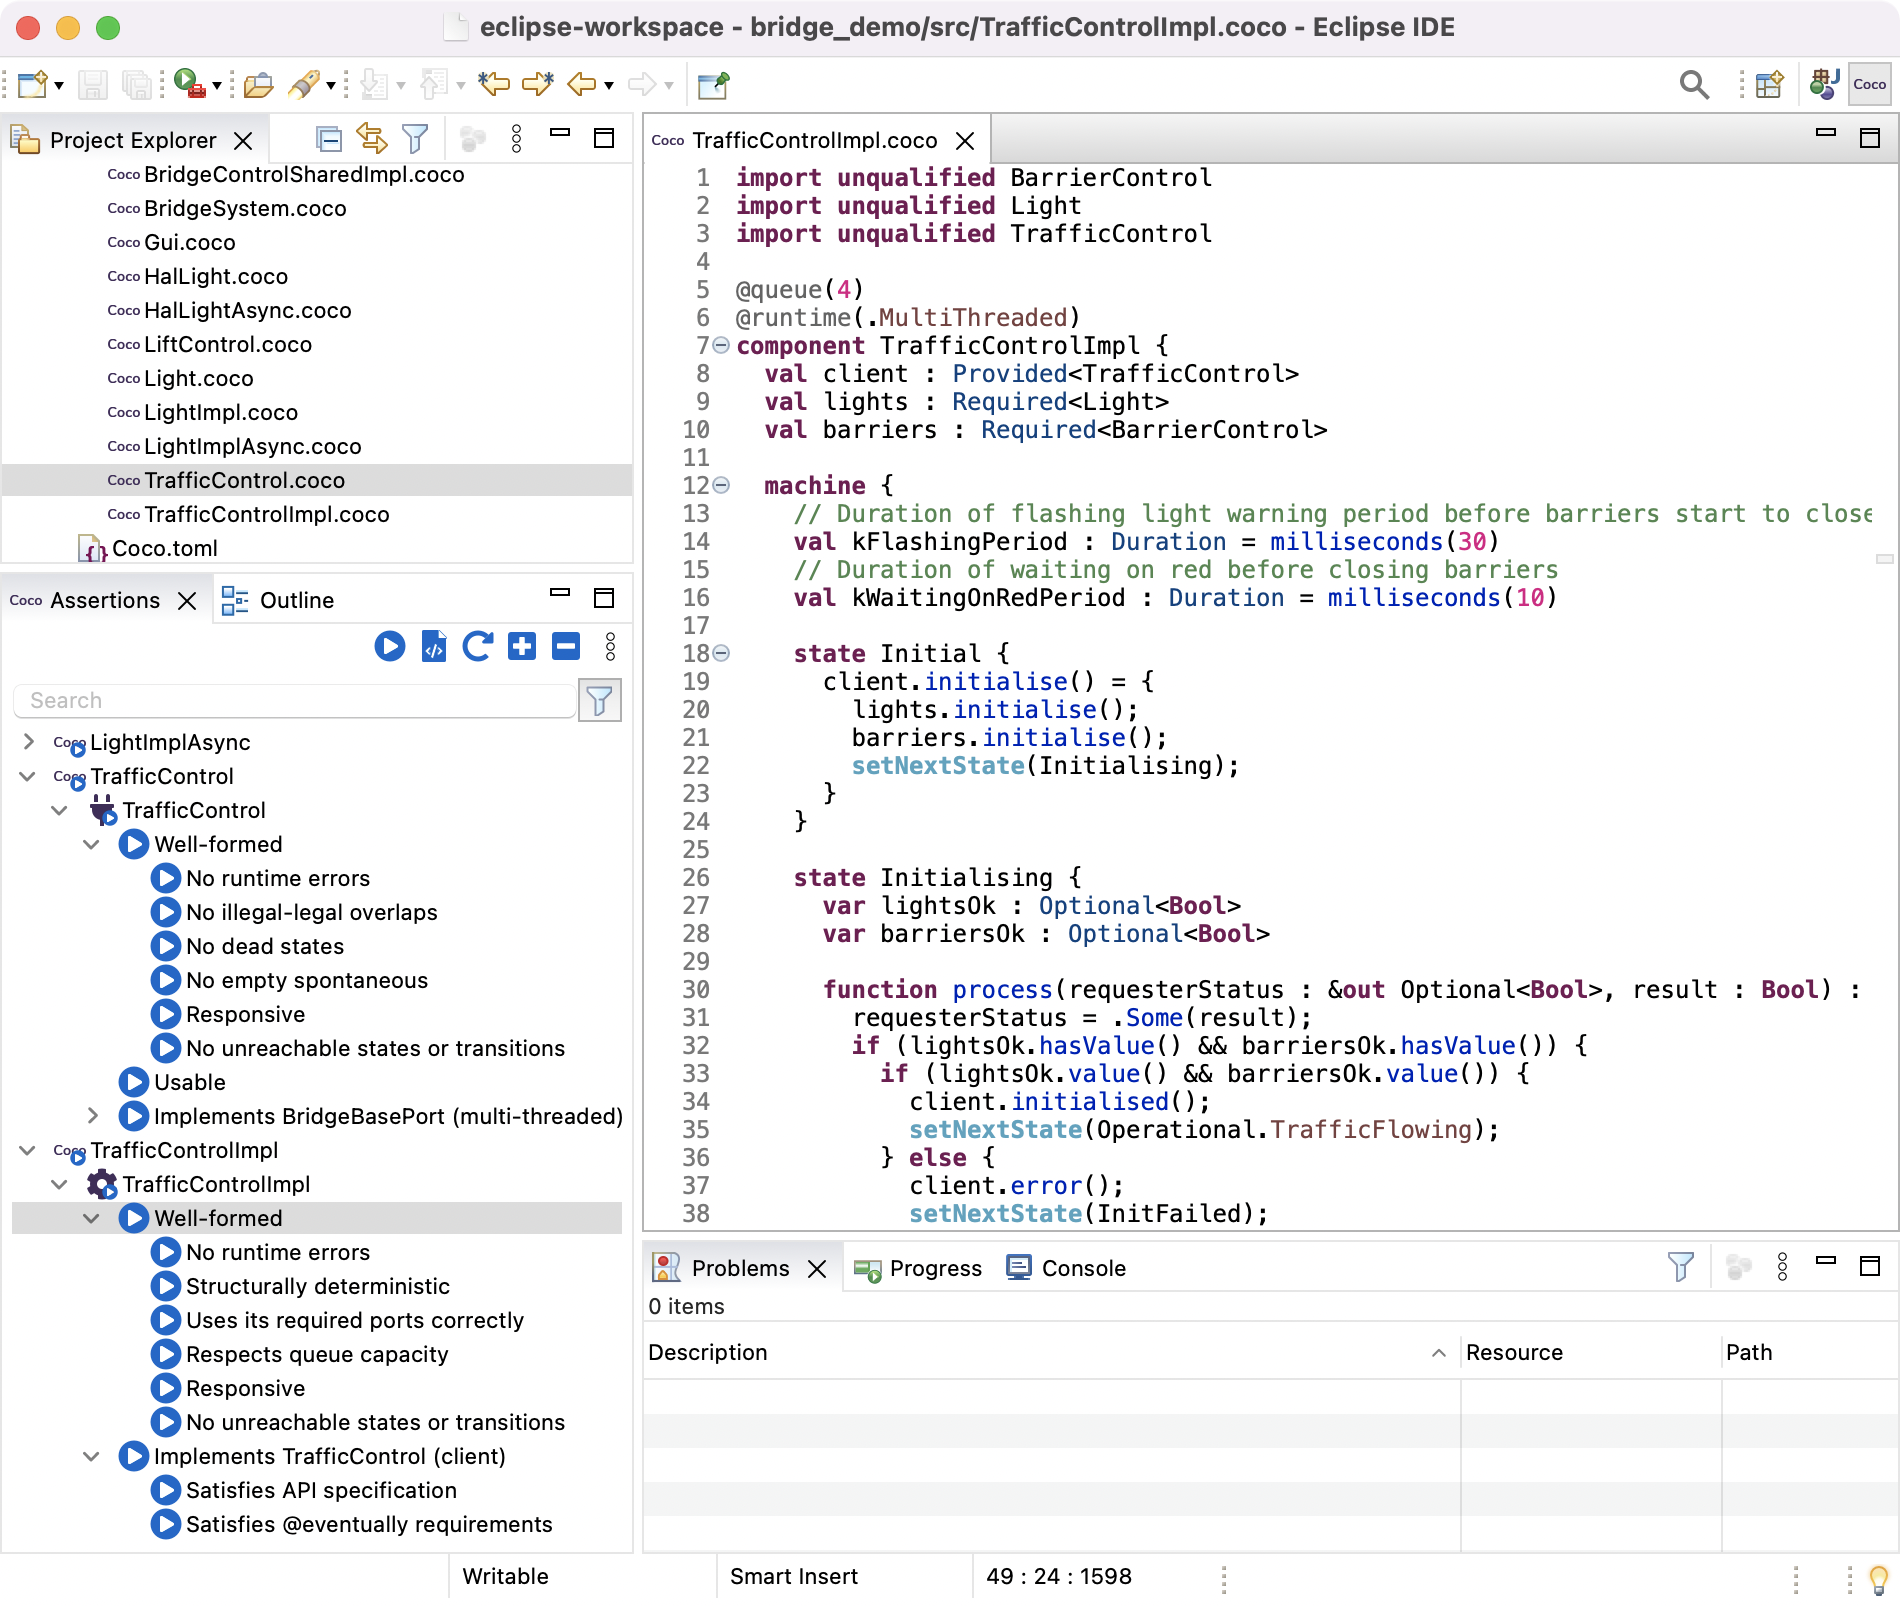
In the following example, a project with multiple Coco modules has been opened, as listed in the Project Explorer view.
The module called TrafficControlImpl.coco is open in the Coco Editor view, and all the assertions for the port
TrafficControl and component TrafficControlImpl have been expanded (in the Assertions view) to illustrate the
list of properties that are verified for ports and components.
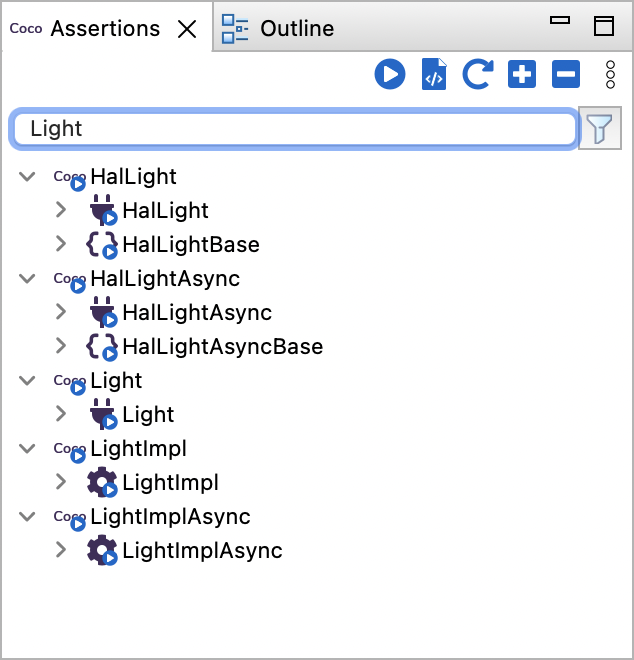
The Assertions view has a search facility, which allows you to search the assertions tree for names of folders, modules, ports and components. As soon as you start typing in the Search box, all of the non-matching items are filtered out of the list of assertions, for example:
The Assertions view also allows you to filter the assertions based on the type of item, or verification results. To select a filter, click on the filter icon next to the search box near the top of the Assertions view, which will result in a popup menu appearing with a list of options:
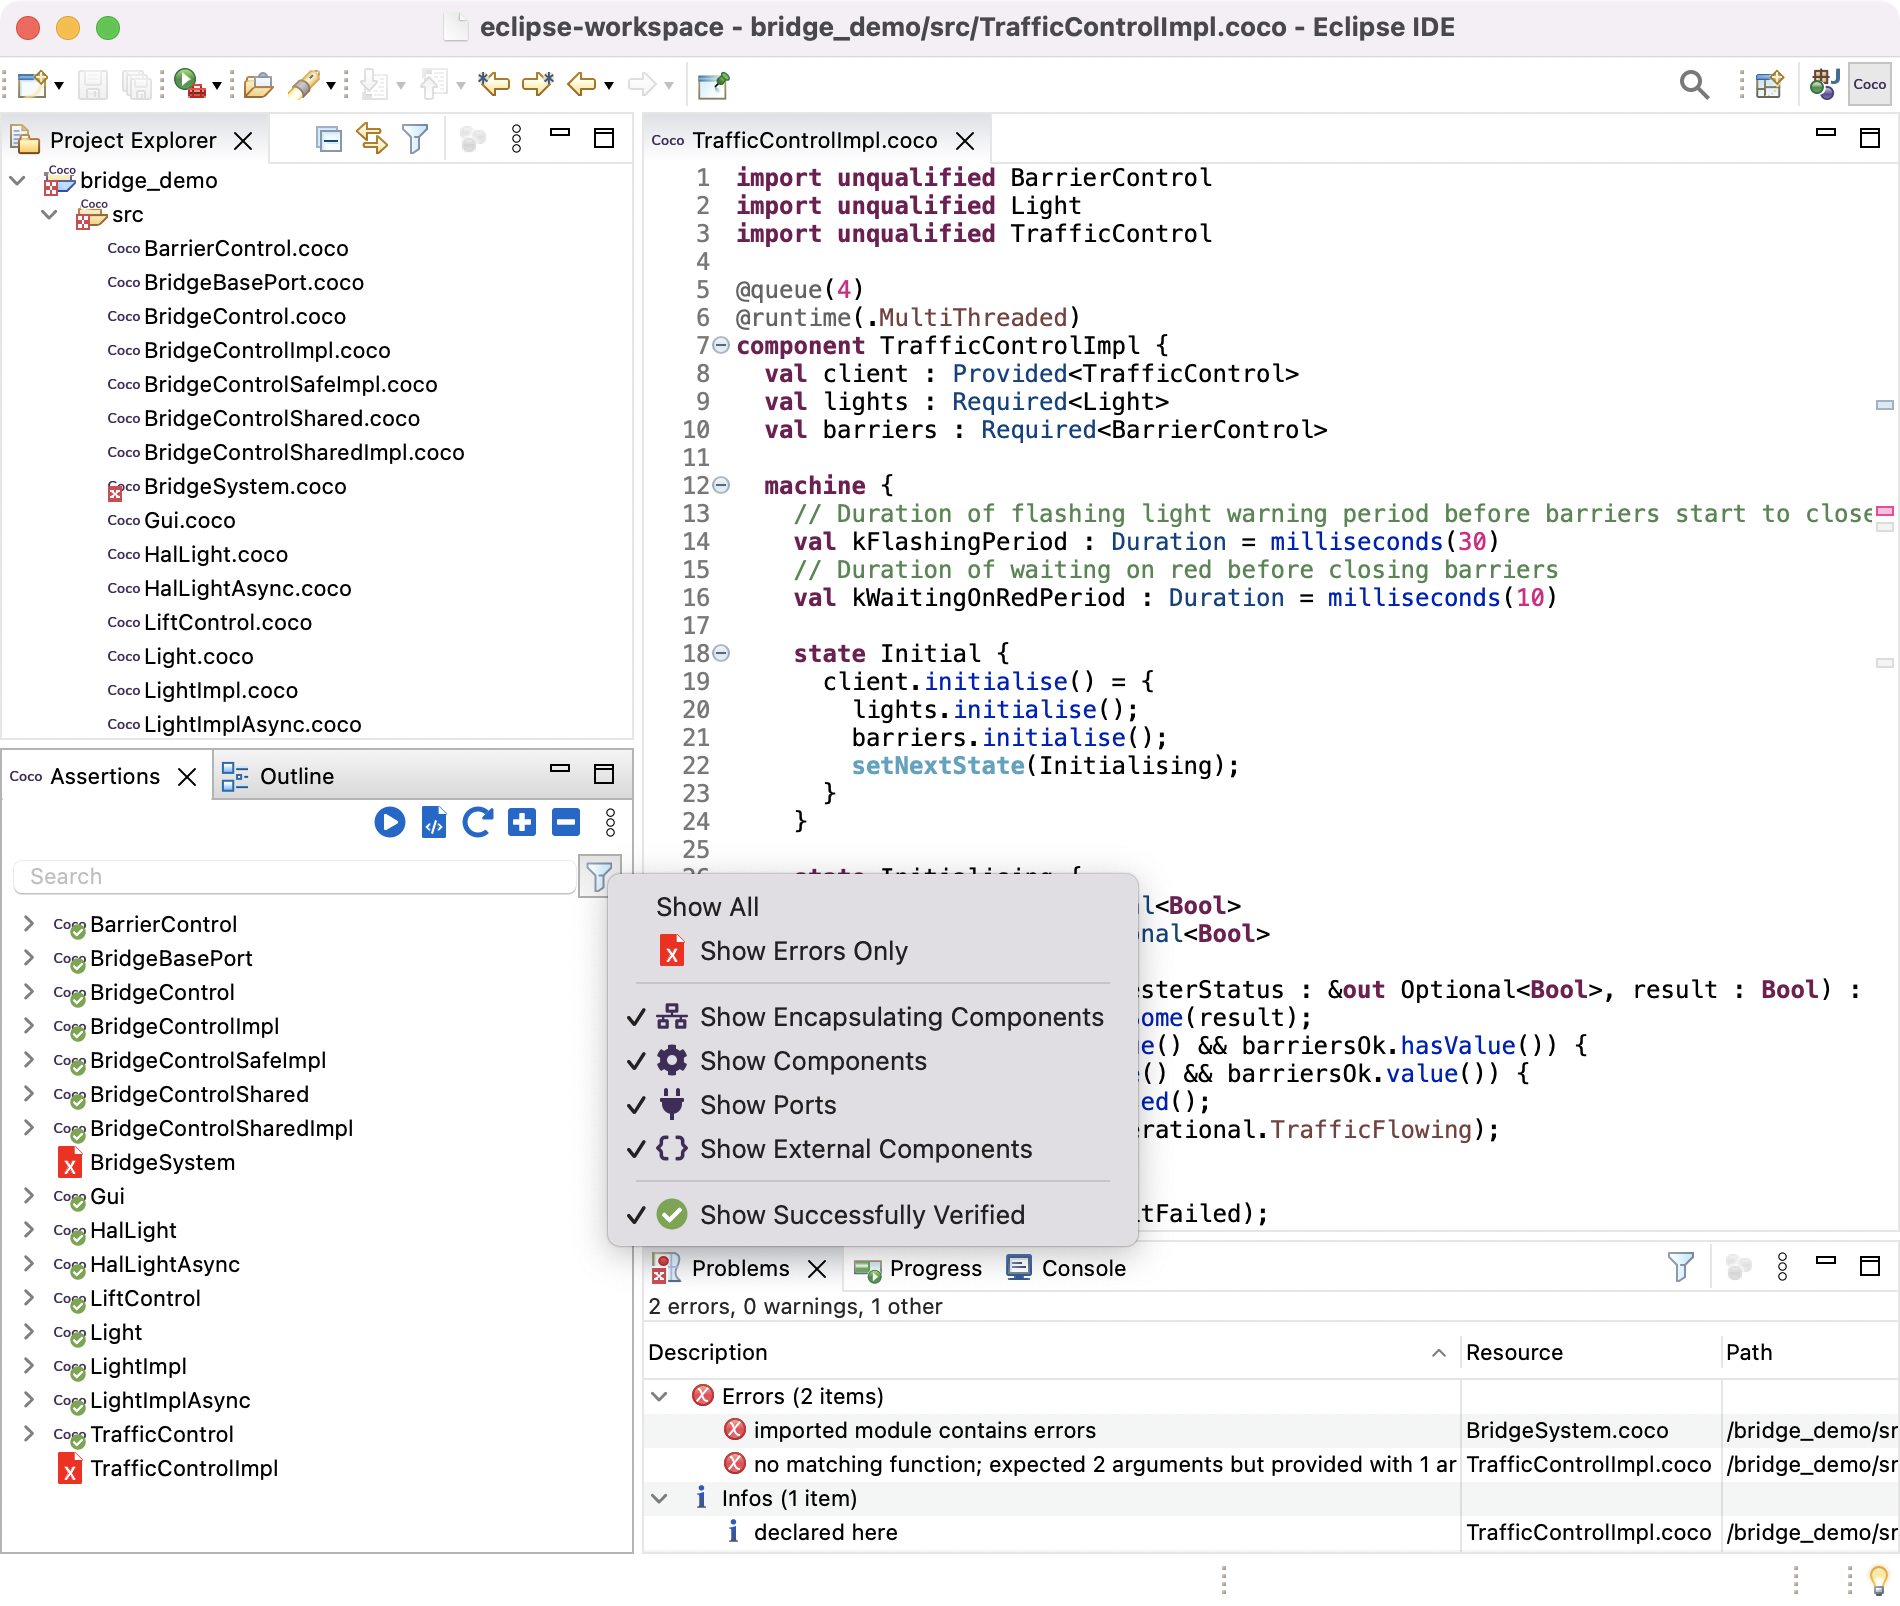
By default, all assertions are displayed unfiltered. You can select which assertions to filter out by ticking or unticking
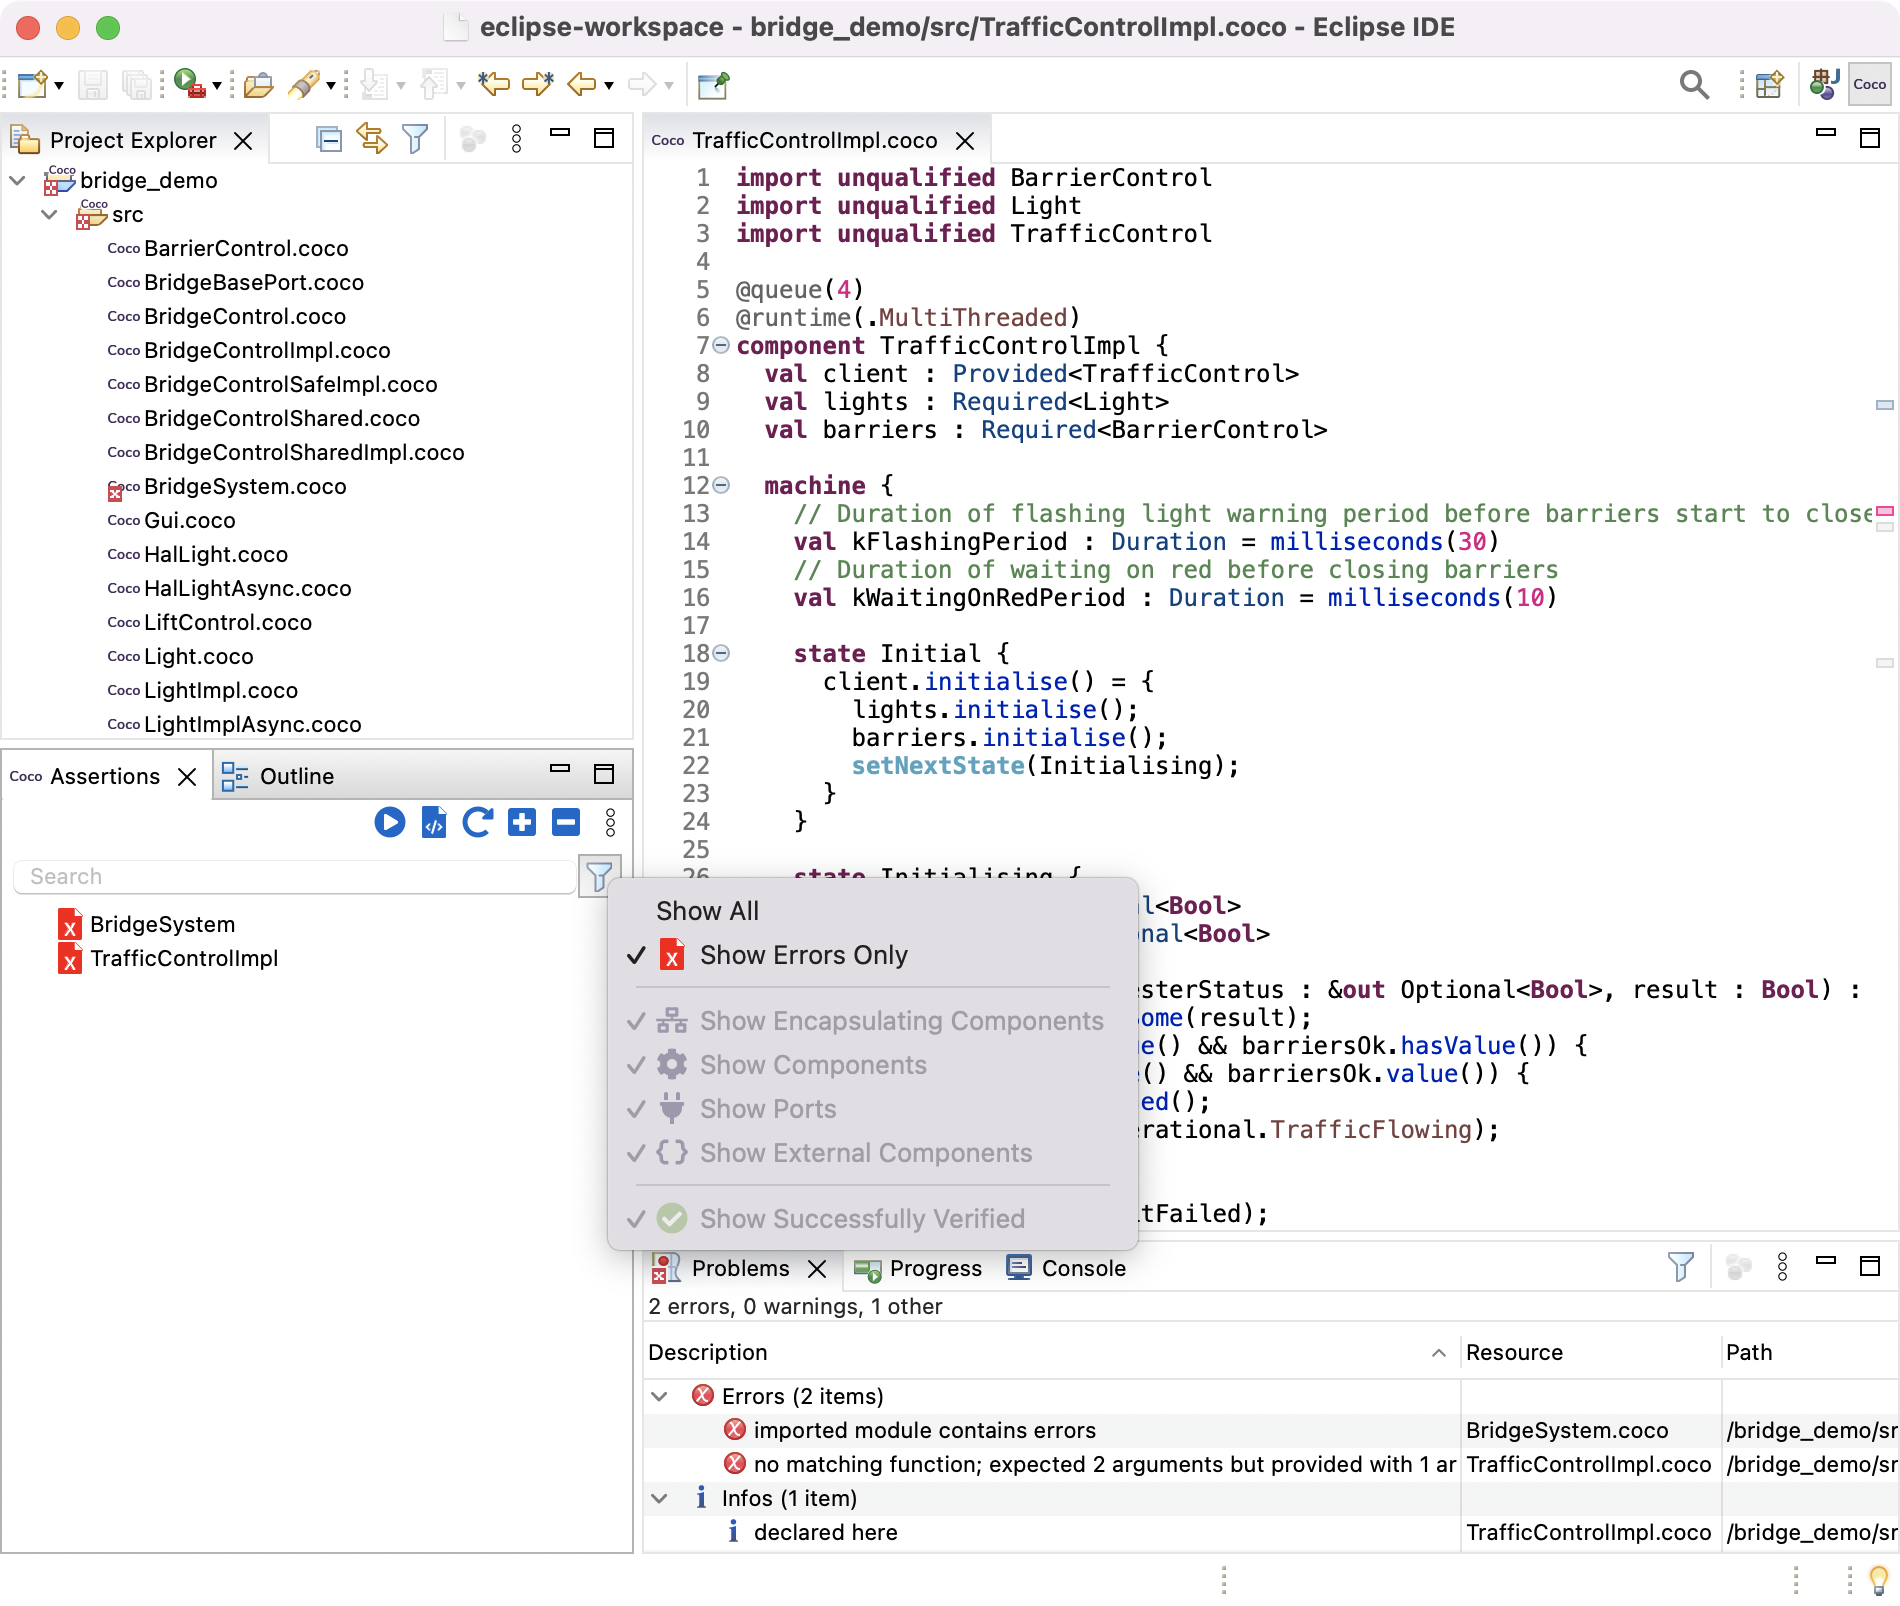
the options in the popup menu. For example, if you select Show Errors Only, then the Assertions view will only
list assertions that have static errors in them (denoted by  ), and will therefore not be verified:
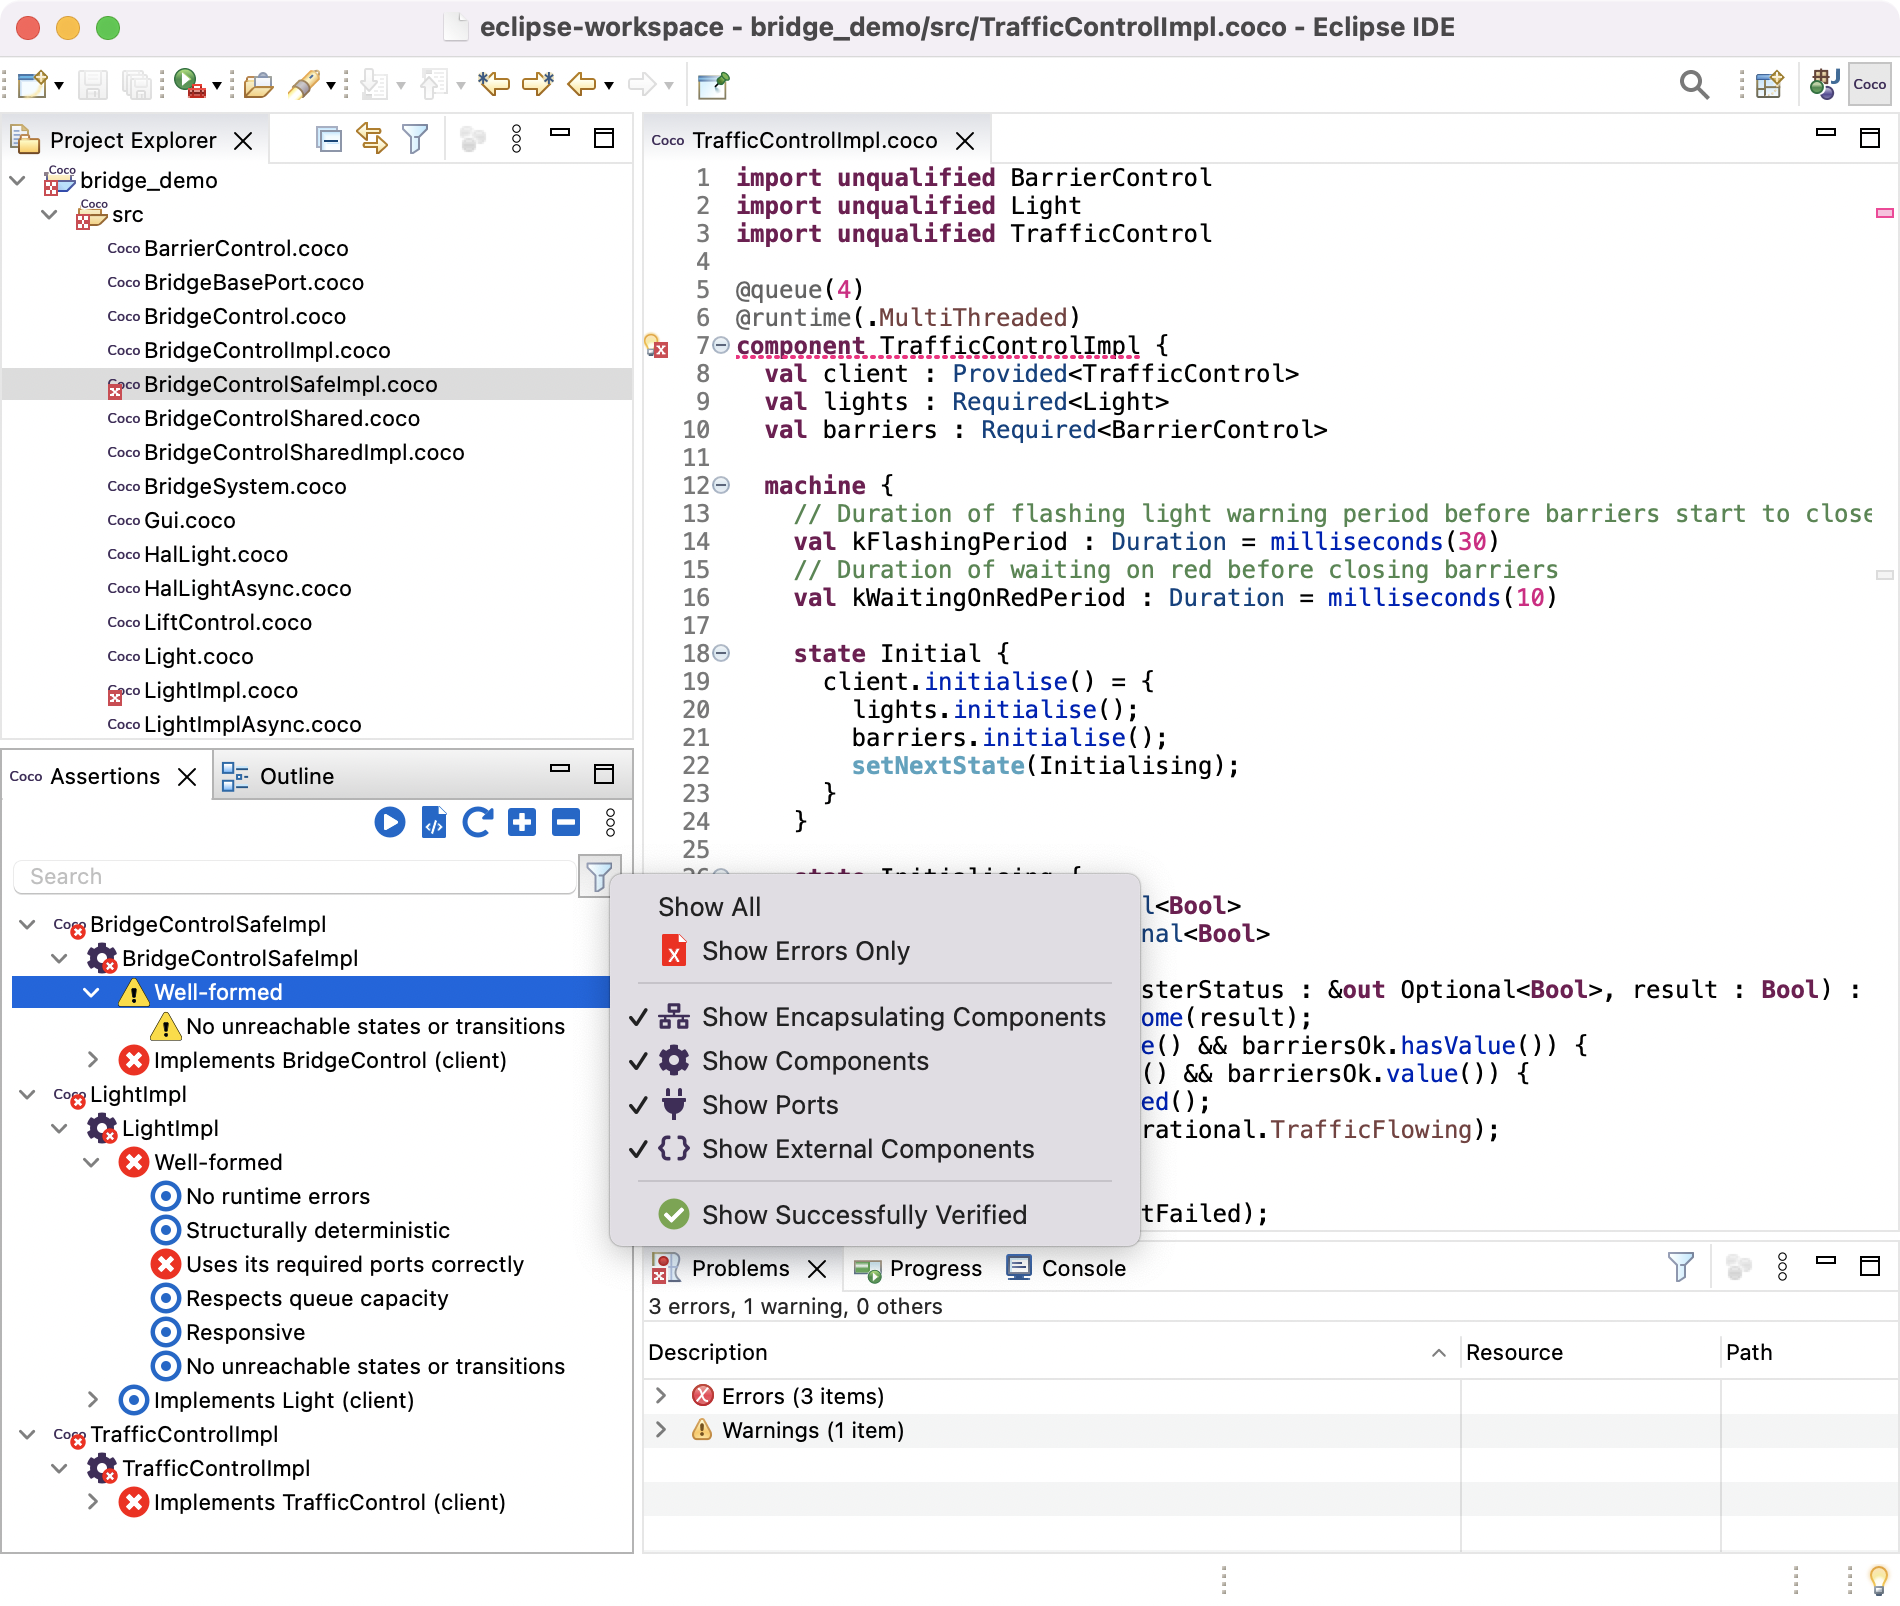
As another example, if you untick Show Successfully Verified, then only the assertions that have failed the verification are listed in the Assertions view:
Running the Verification
The verification can only be run on Coco projects and modules that do not have any static errors in them. Assertions for
modules that do have such errors are labelled with , and will also have corresponding error messages in the modules
themselves.
The verification can be run on an entire project either by:
- Clicking on in the Assertions view toolbar;
- Right-clicking on the project in the Project Explorer view, and selecting Popili → Run Assertions or Popili → Run All Assertions; or
- Selecting the project in the Project Explorer view, and using the keyboard shortcut Cmd+R on macOS, or Ctrl+R on Linux/Windows.
The following table summarises the possible results and corresponding icons that assertions can be labelled with:
| Icon | Assertion Status |
|---|---|
|
|
The Coco module has static errors in it, and therefore cannot be verified. |
|
|
Not verified. |

|
The verification is currently running. |

|
Passed the verification successfully. |

|
Failed the verification with a warning. |

|
Failed the verification with an error. |

|
The verification failed due to an error in the Coco module. |

|
Not verified due to a verification failure of an assertion that it depends upon. |

|
The verification failed due to an error with the remote verification service. |

|
An internal error occurred during the verification. |

|
A timeout occurred whilst running the verification. |

|
Verification consumed too much memory and was therefore aborted. |
Popili runs the verification for the assertions in a specific order, reflecting the dependencies between them.
If an assertion fails, then all assertions that depend upon it passing the verification successfully will not be
verified, and are labelled with accordingly.
By default, Popili will not rerun the verification for assertions that have cached verification results, thereby making the verification faster and more efficient, particularly when run on large projects. Assertions are labelled accordingly to indicate whether cached verification results are available, and if so what the results are. This can be overridden by holding down the Shift key when clicking the green play button in the Assertions view toolbar.
When editing Coco modules that have already been verified, Popili intelligently identifies which assertions are
impacted by the changes made. For example, any changes made to
comments in a module would not impact the verification results of any of the assertions. Only assertions impacted by the
changes will become labelled with again when the changes are saved, and will therefore have to be
reverified.
Rather than running the verification on an entire project, you can also verify individual assertions by simply double-clicking on them. This will verify the selected assertion, together with any other assertions that it depends upon. For example, when verifying a component assertion, the verification will also verify all ports that are provided or required by that component.
Counterexamples View
When the verification has finished, the assertions in the Assertions view are labelled with icons indicating the verification results, which are described in the assertions results table above. Running the verification on all of the assertions for our TrafficControlImpl example leads to the following results:
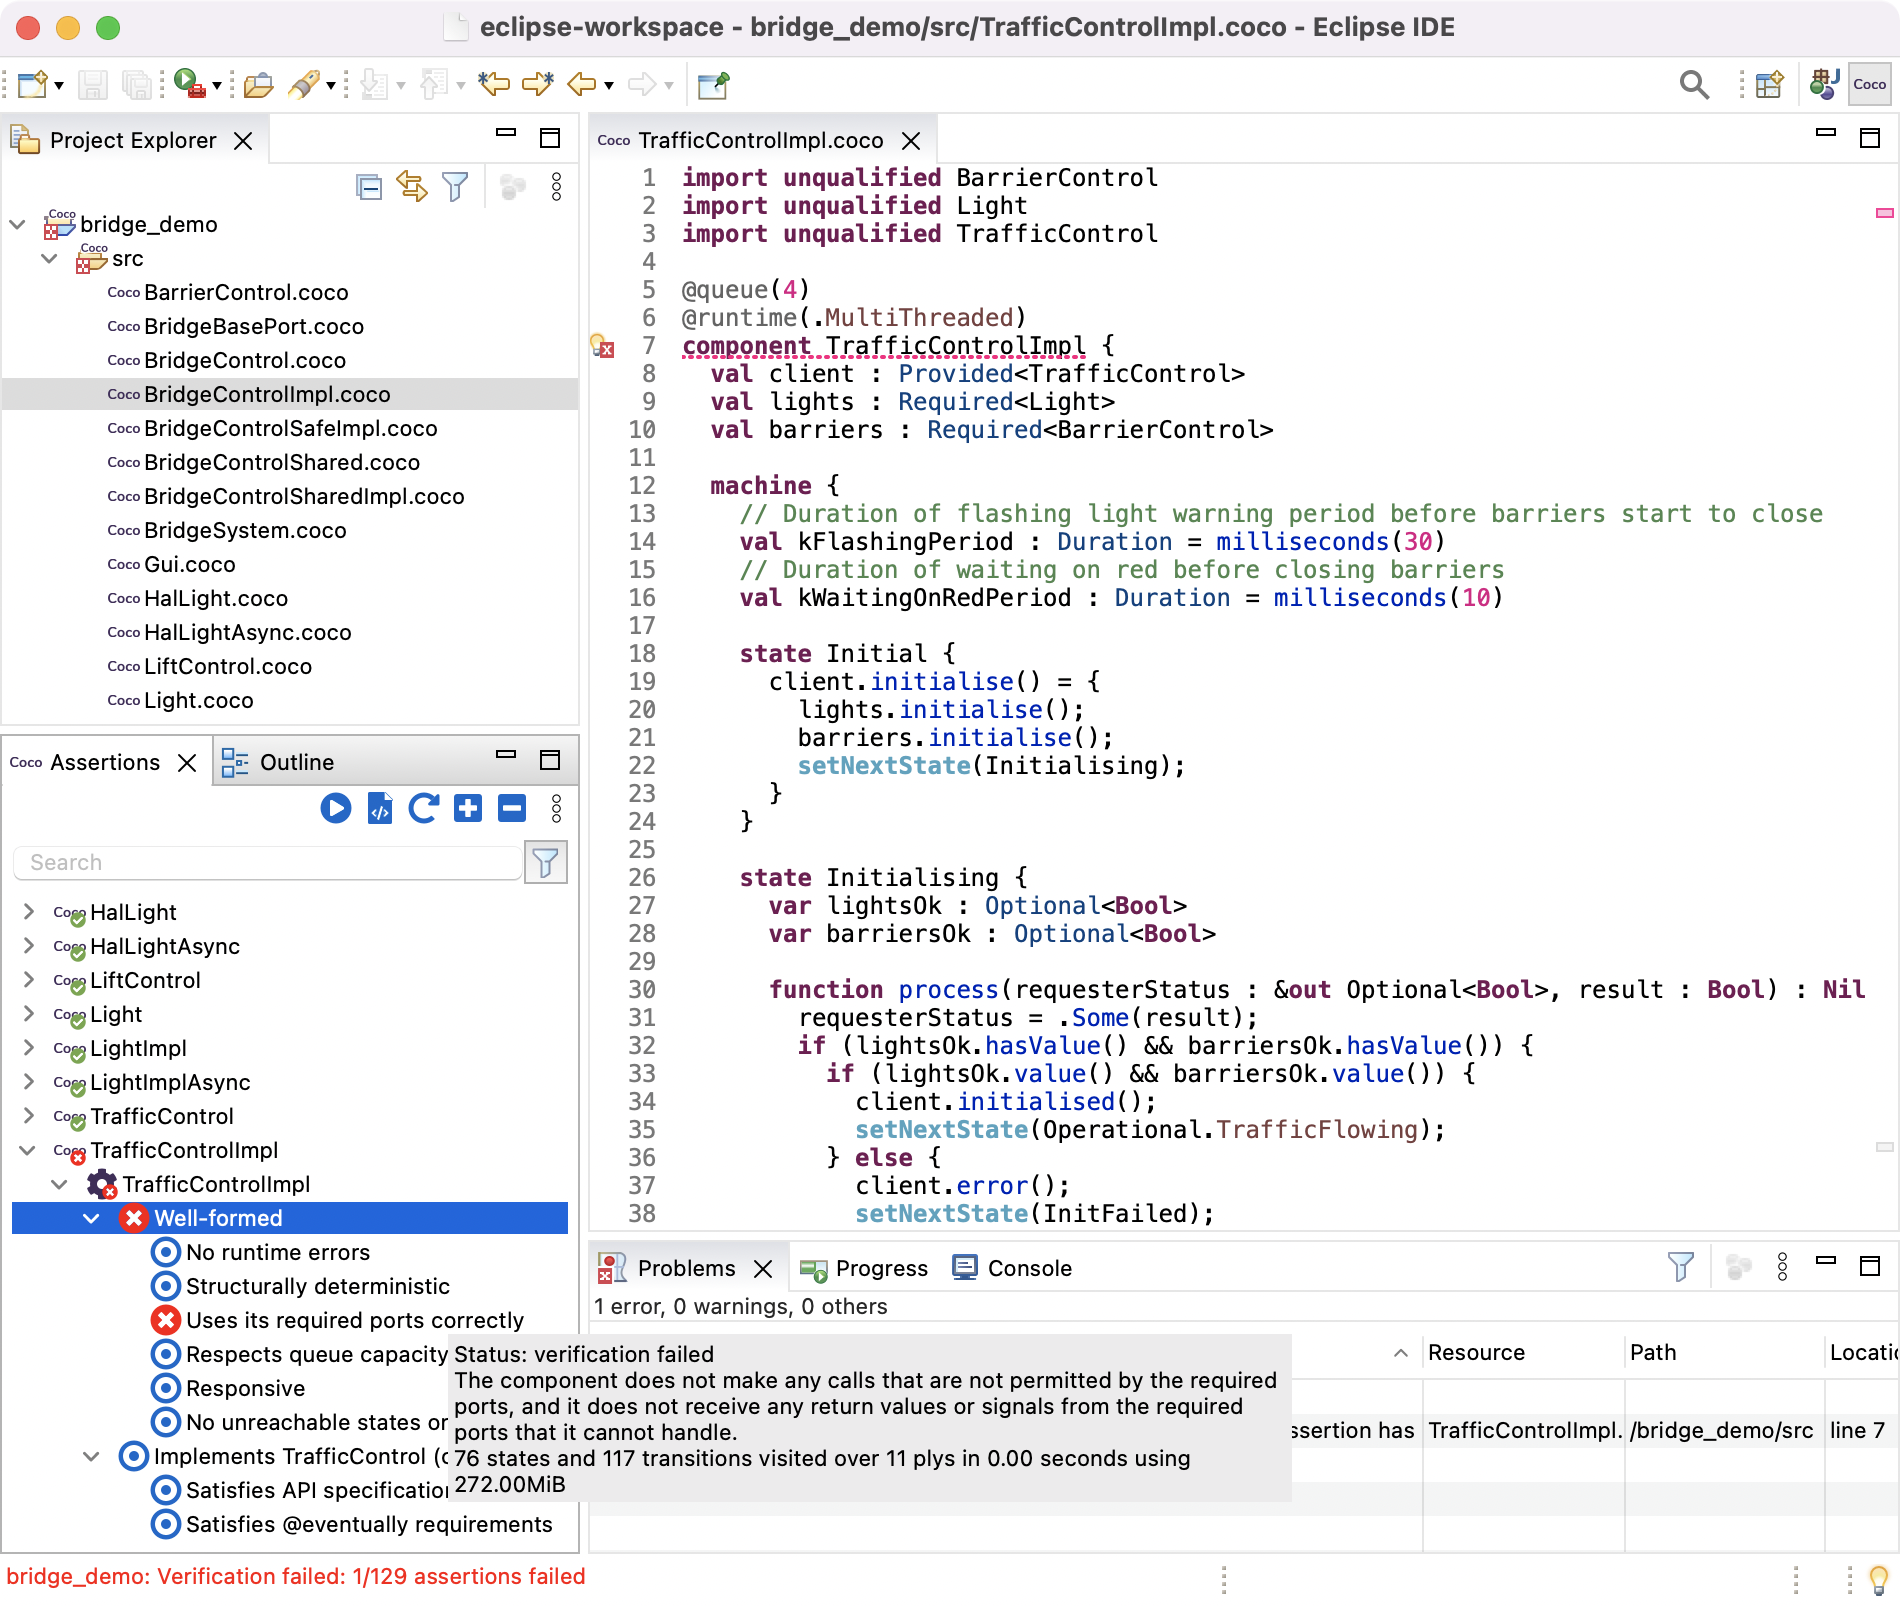
As illustrated above, if you hover your cursor over any of the assertions, then a tooltip will be displayed providing a
brief description of the property being verified, its verification status, and additional information about the verification
including the number of states and transitions visited, and the time taken to verify the selected assertion. In this example,
one of the well-formedness assertions for the TrafficControlImpl component has failed (denoted by ).
As a result, a number of other assertions that are dependent upon this one were not able to be verified
(denoted by ).
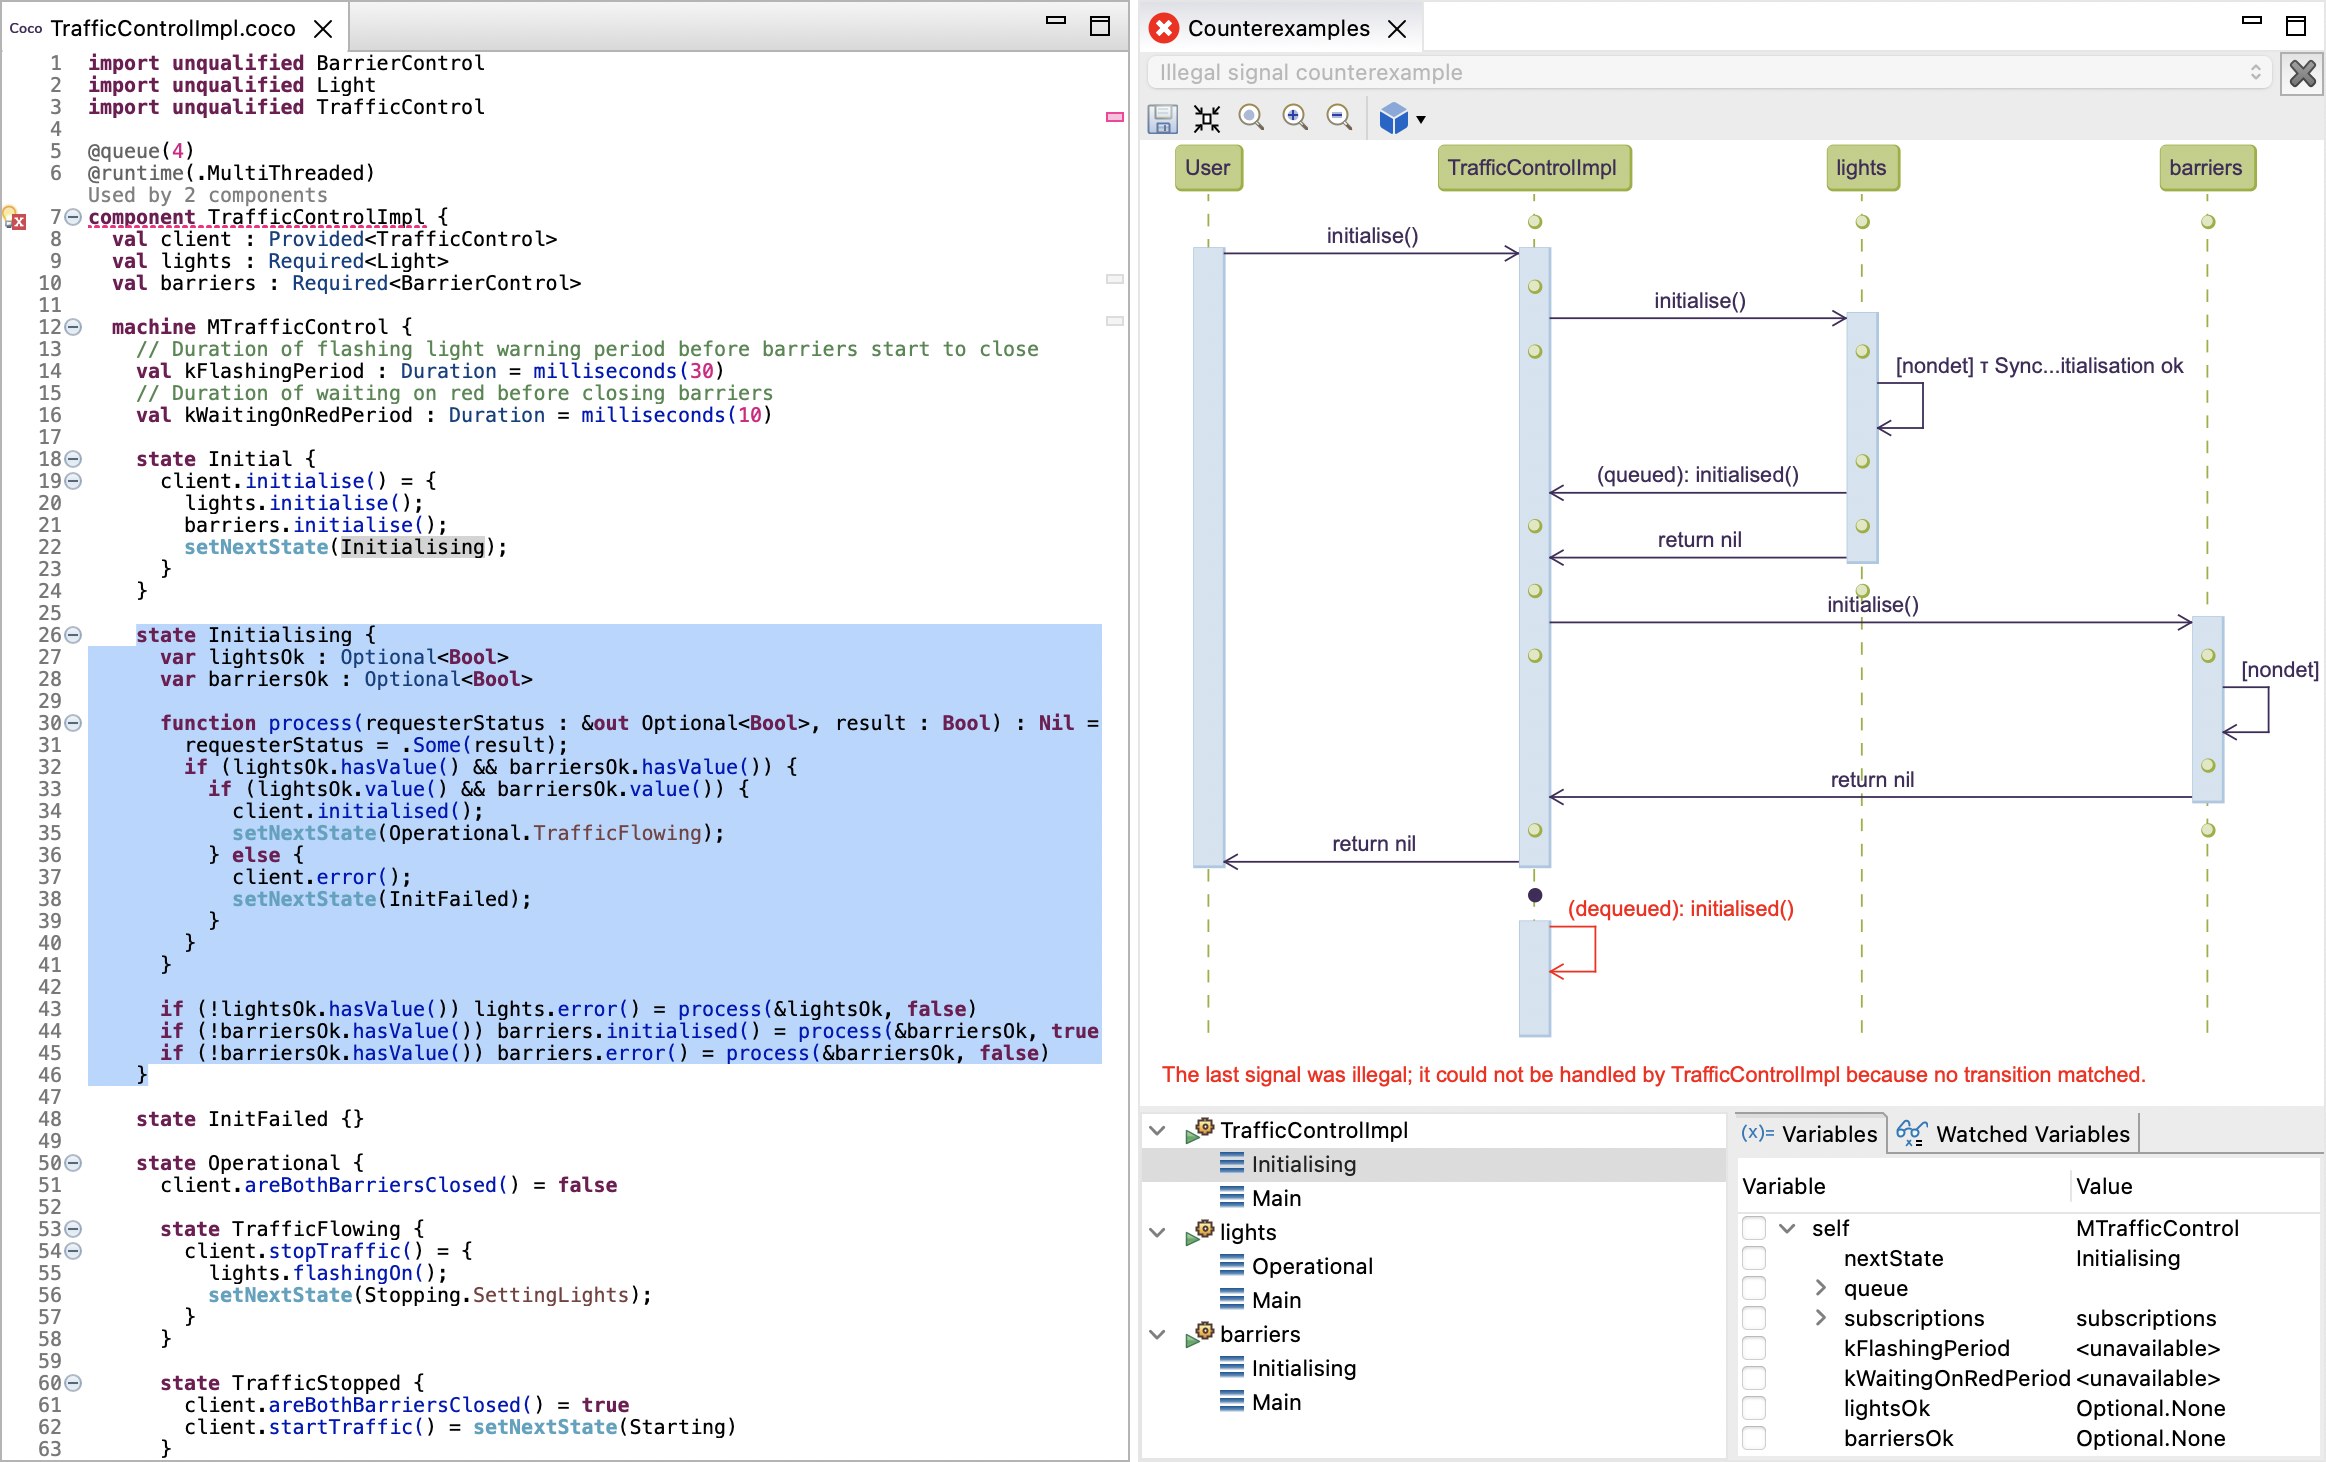
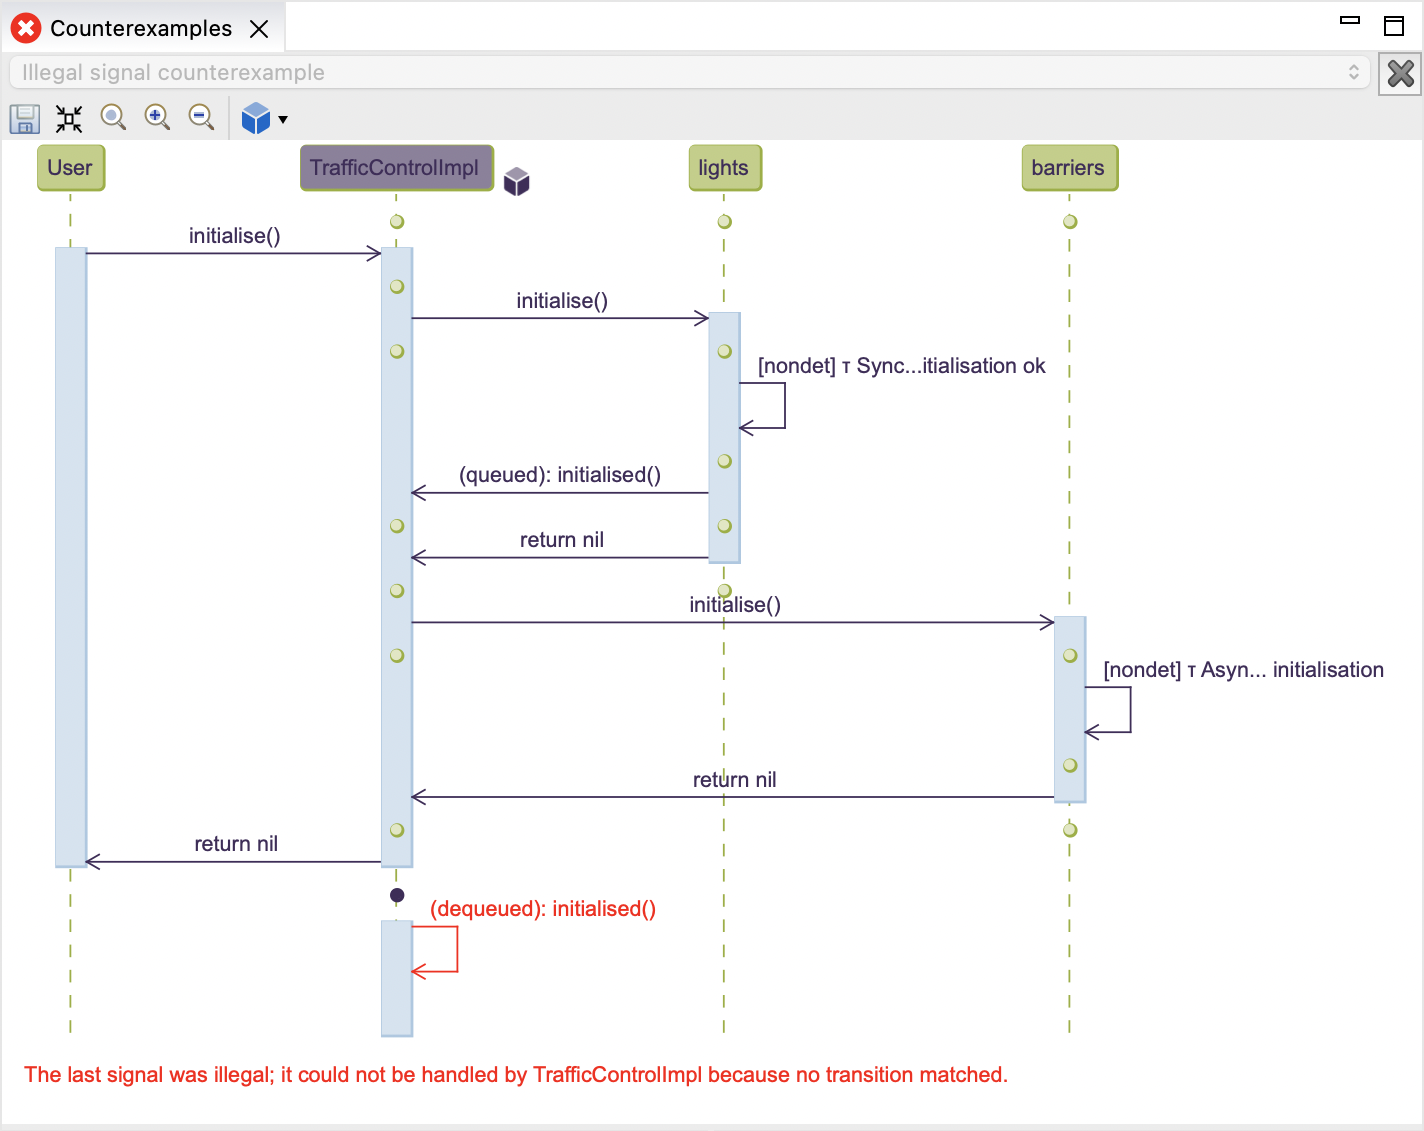
If an assertion has failed with a verification error, then you can view extensive debugging information describing the error by double-clicking on the failed assertion. Using our example above, the following counterexample of the error is displayed in the Counterexamples view:
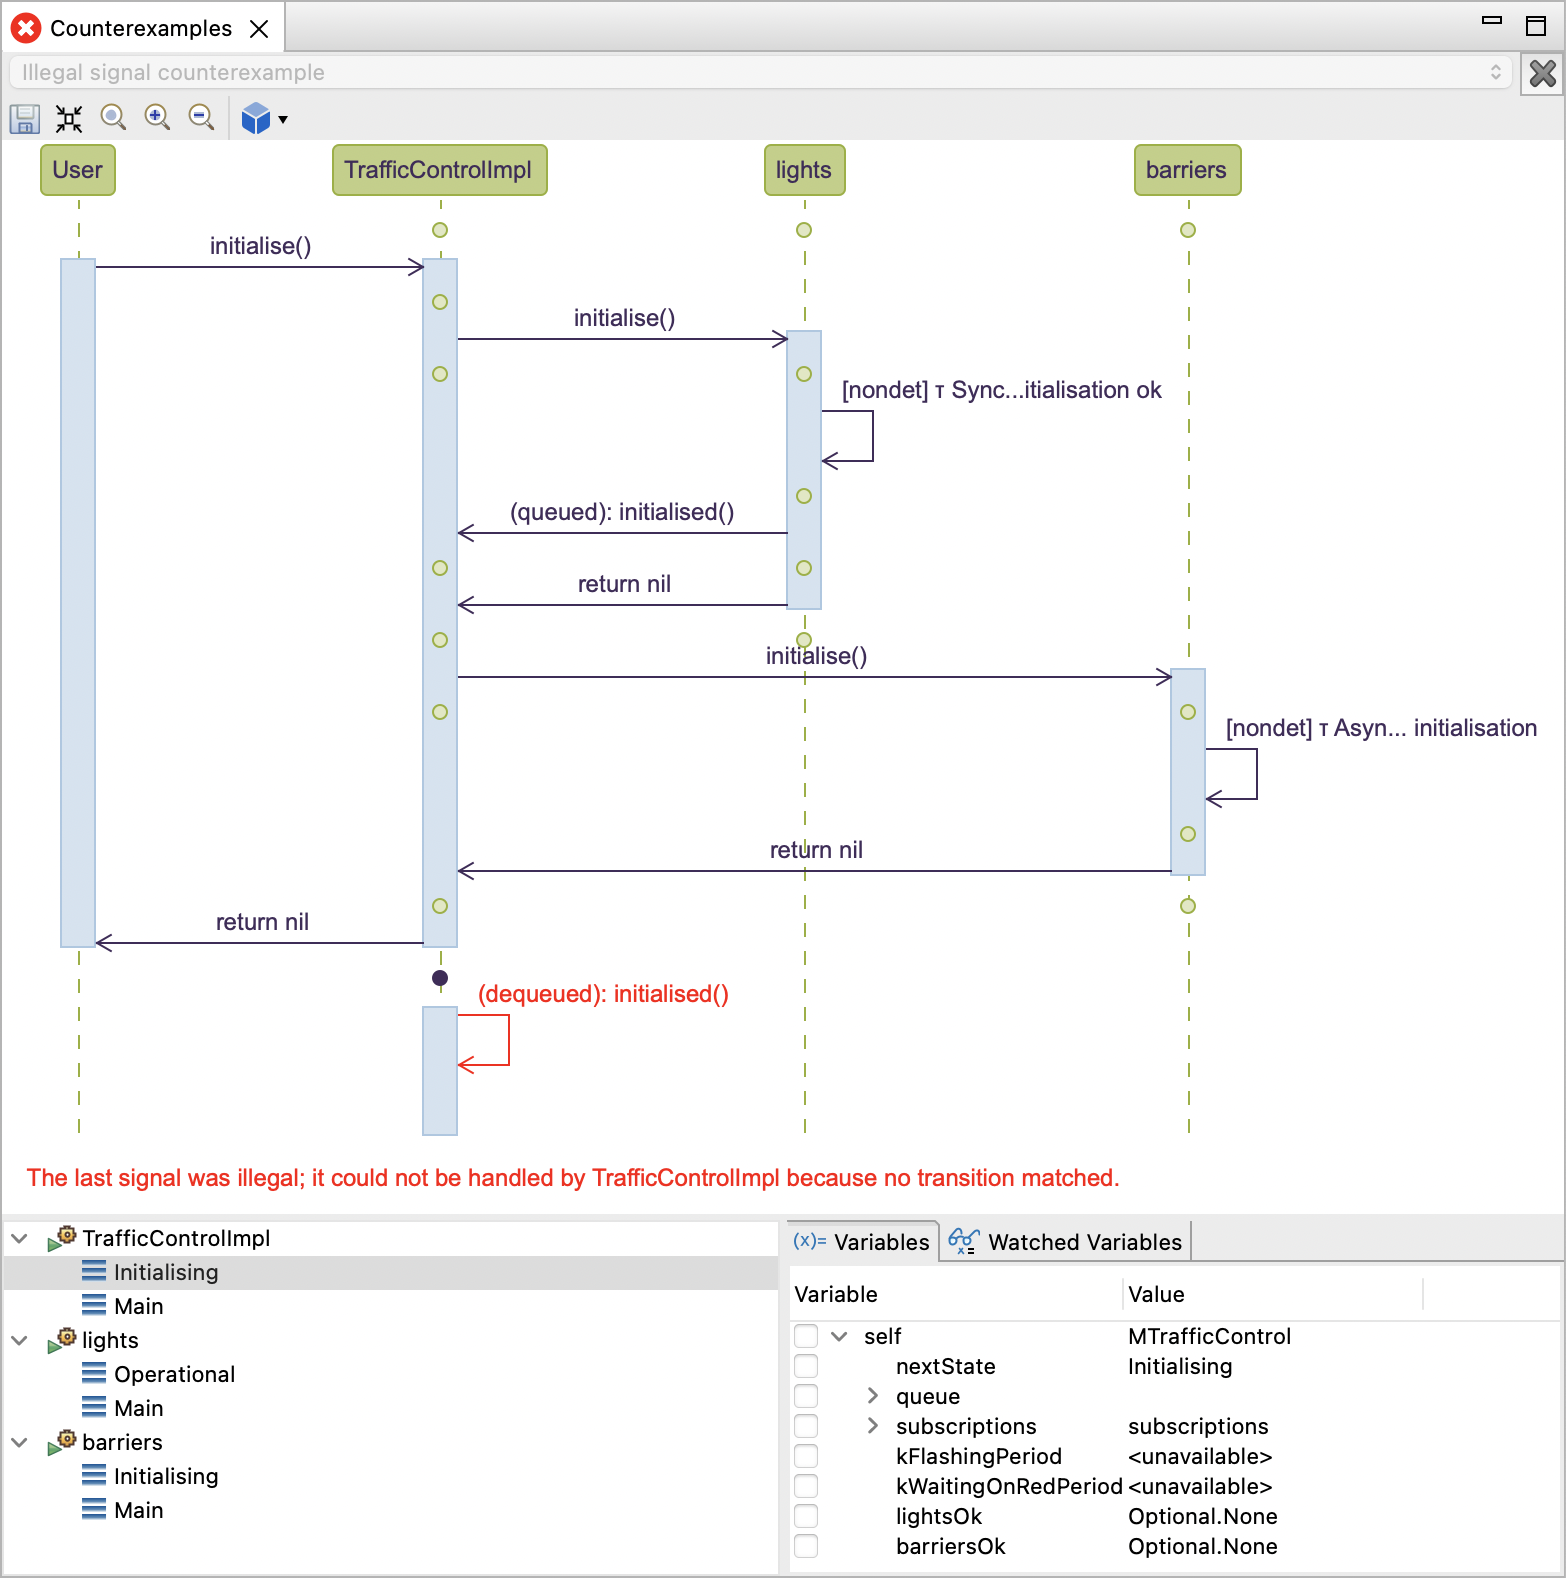
With the exception of the reachability assertions, the top pane in the Counterexamples view displays a sequence
diagram, describing (one of) the shortest
sequences of interactions that led to the assertion being violated. The sequence diagram consists of swim lanes, one for
each component or port involved in the counterexample, and some additional ones which vary depending on the type of
assertion that failed. For example, in the counterexample presented above, there is a swim lane for the component
TrafficControlImpl, the required port instances lights and barriers, and then an additional one labelled User,
which represents an external user invoking all possible calls allowed by the component. For further details on what
properties are verified, together with examples of how the different types of verification errors are presented, see
Coco Language Reference.
The bottom pane in the Counterexamples view displays additional debugging information, such as stack traces for all of the relevant components and ports, variable assignments, queue contents, and subscription status. You can also select specific variables to watch, resulting in them being added with their respective values as annotations on every state in the sequence diagram where they are in scope. See Watching Variables for further details.
The two panes in the Counterexamples view are interactively linked to one another, and to the corresponding Coco Editor view. This means that you can explore different states in the counterexample either by clicking on any of the states in the sequence diagram, or by selecting states in the stack traces. This will highlight the corresponding code in the Coco Editor view, and show what values are assigned to the variables, along with other information such as the queue contents for your selected state:
The Counterexamples view also has a popup menu, which appears by right-clicking anywhere in the view, and provides the options for saving the sequence diagram image to a file, or copying it to the clipboard.
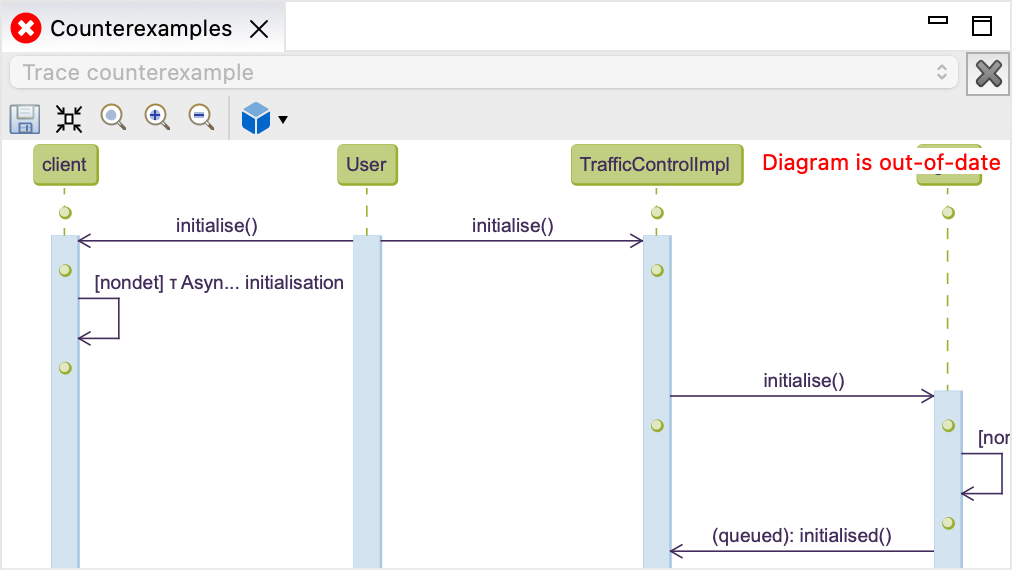
When running the verification, the Counterexamples view displays the most recently loaded counterexample, even when the project has been reverified and the counterexample is not longer relevant. To avoid confusion, stale counterexamples are labelled as being out-of-date:
Reachability Counterexamples
For reachability warnings, Popili provides multiple views for displaying the results. When double-clicking on a reachability assertion that has resulted in a warning, a tabular representation of the results is displayed in the Counterexamples view following the Structure Viewer format. In addition, the code for the port or component declaration being verified is also highlighted to reflect the reachability information. The following simple example illustrates both of these views:
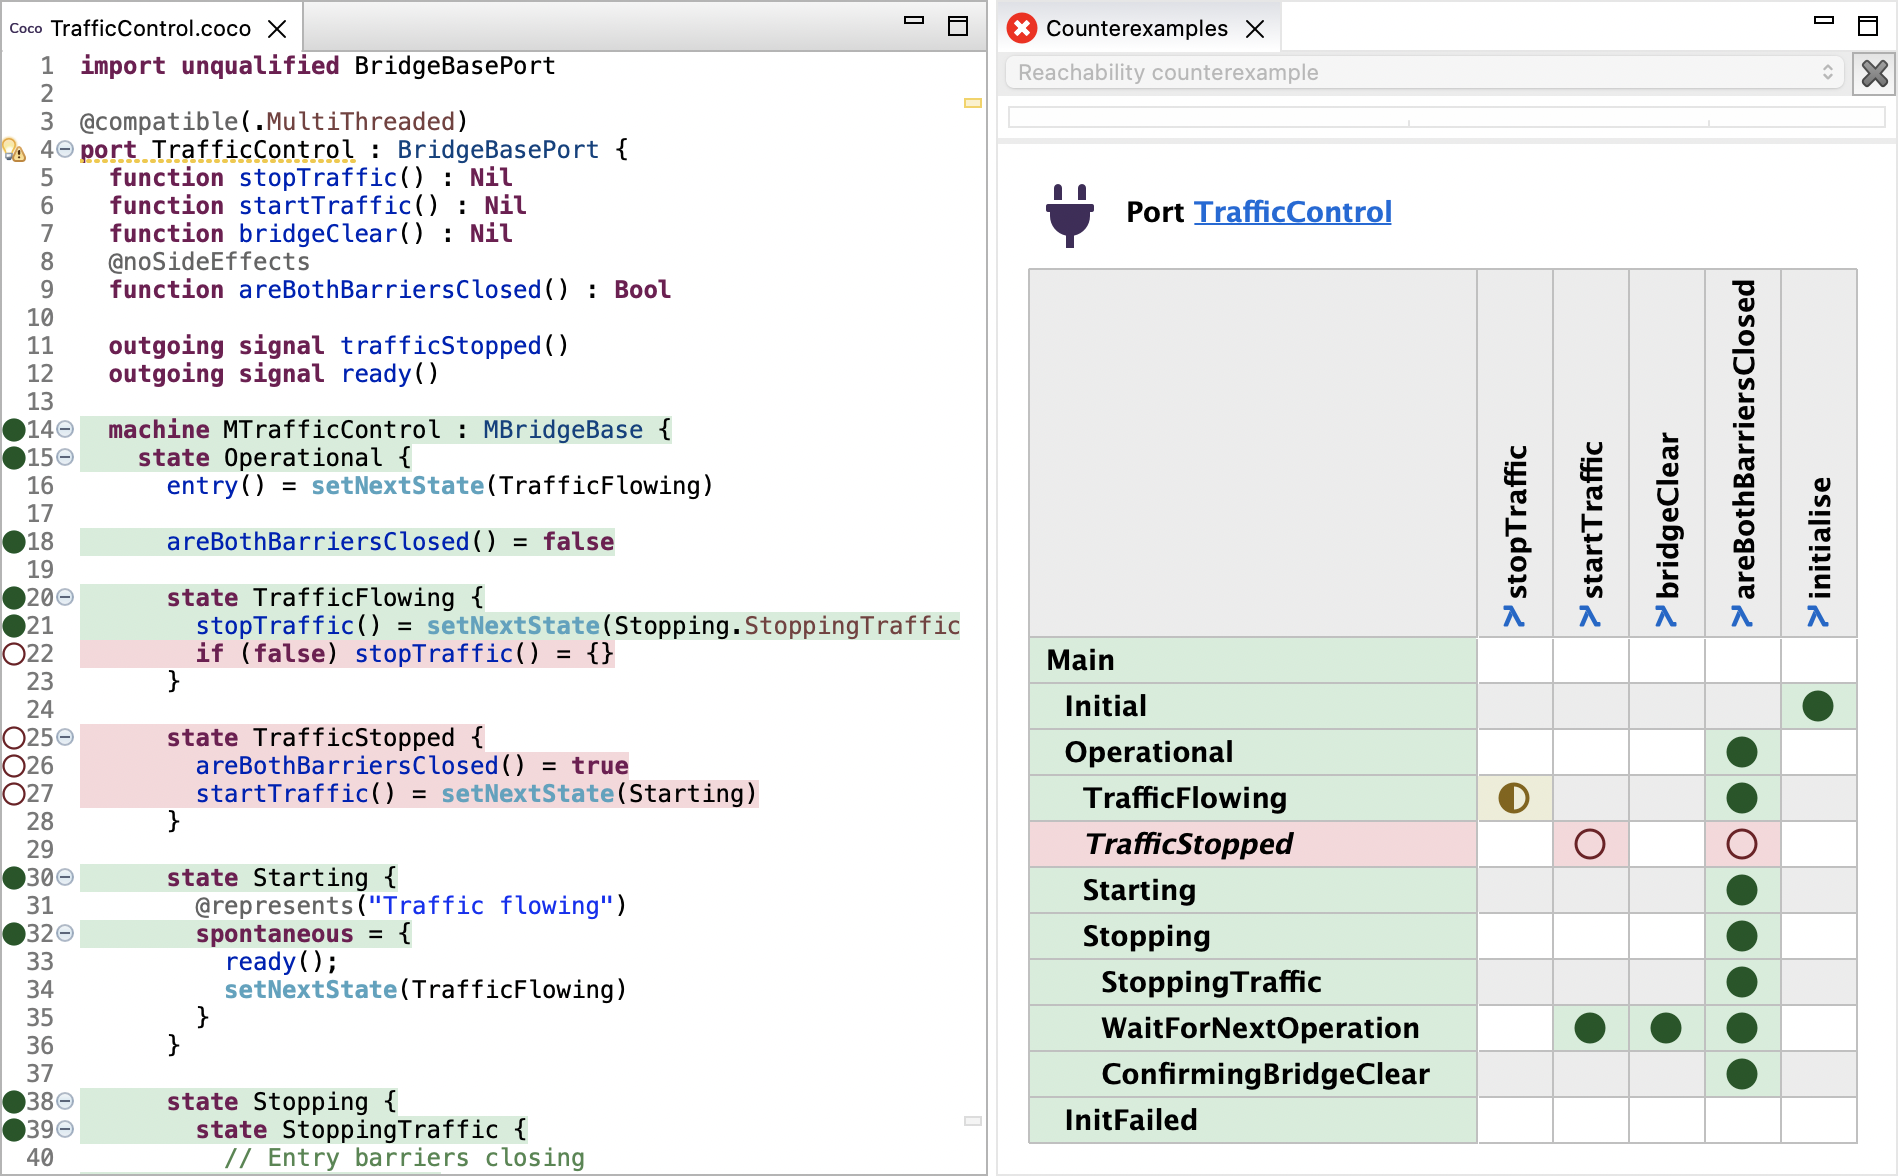
In this example of the reachability results for the TrafficControl port, the nested state TrafficStopped and its
transition declarations are unreachable. In addition to the views above, these reachability results are also displayed
in the State Machine Diagram view, thereby providing an graphical
representation of this information:
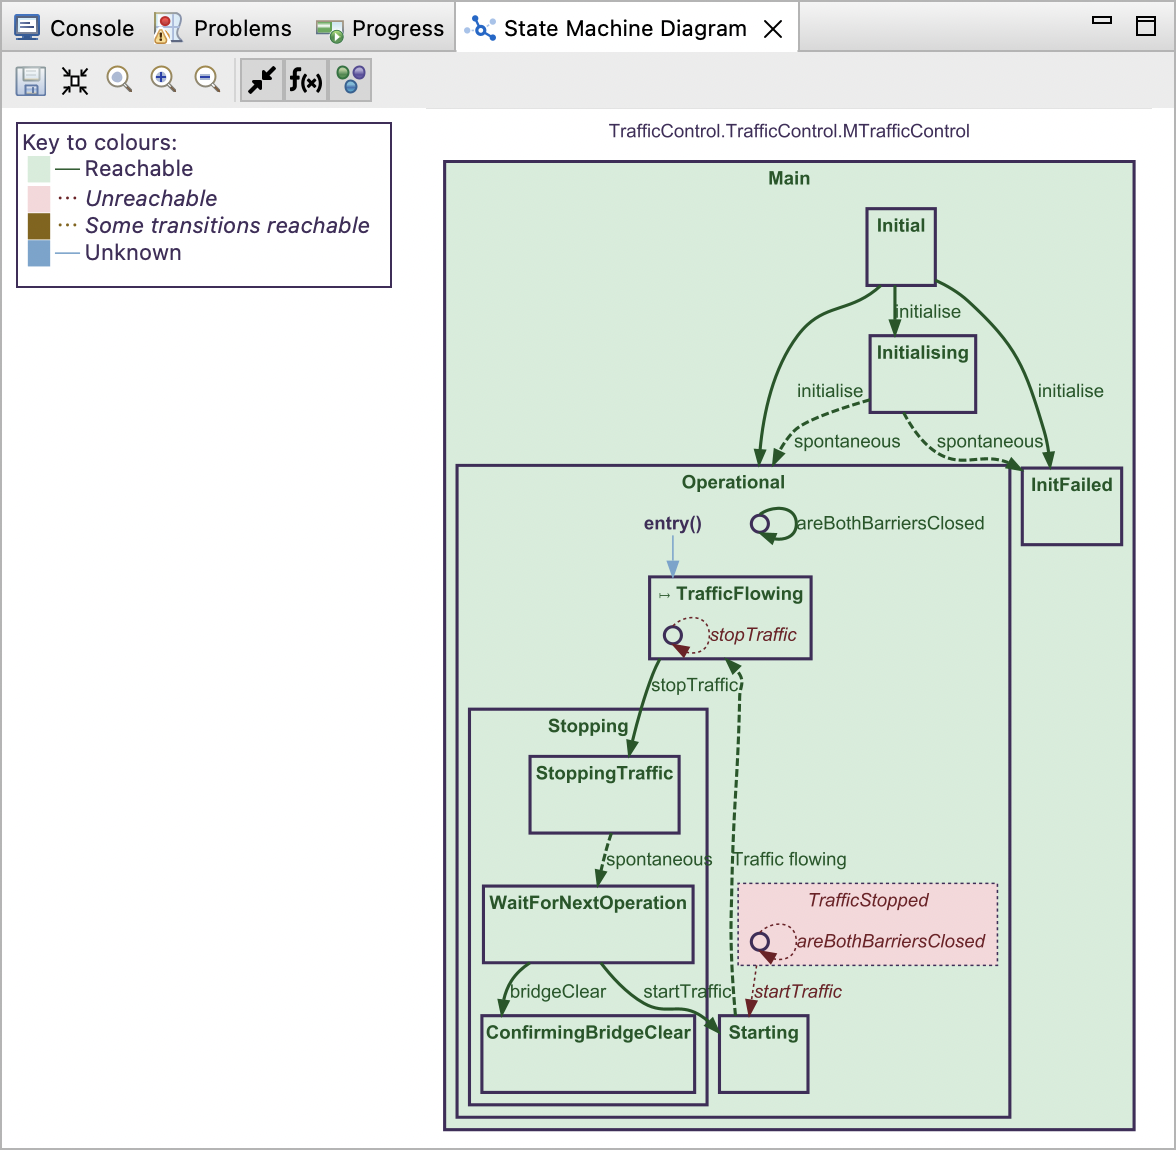
For further information on what these colours and symbols represent in these views, see the reachability for ports and reachability for components sections in the Coco Language Reference.
Launching the Simulator with Counterexamples
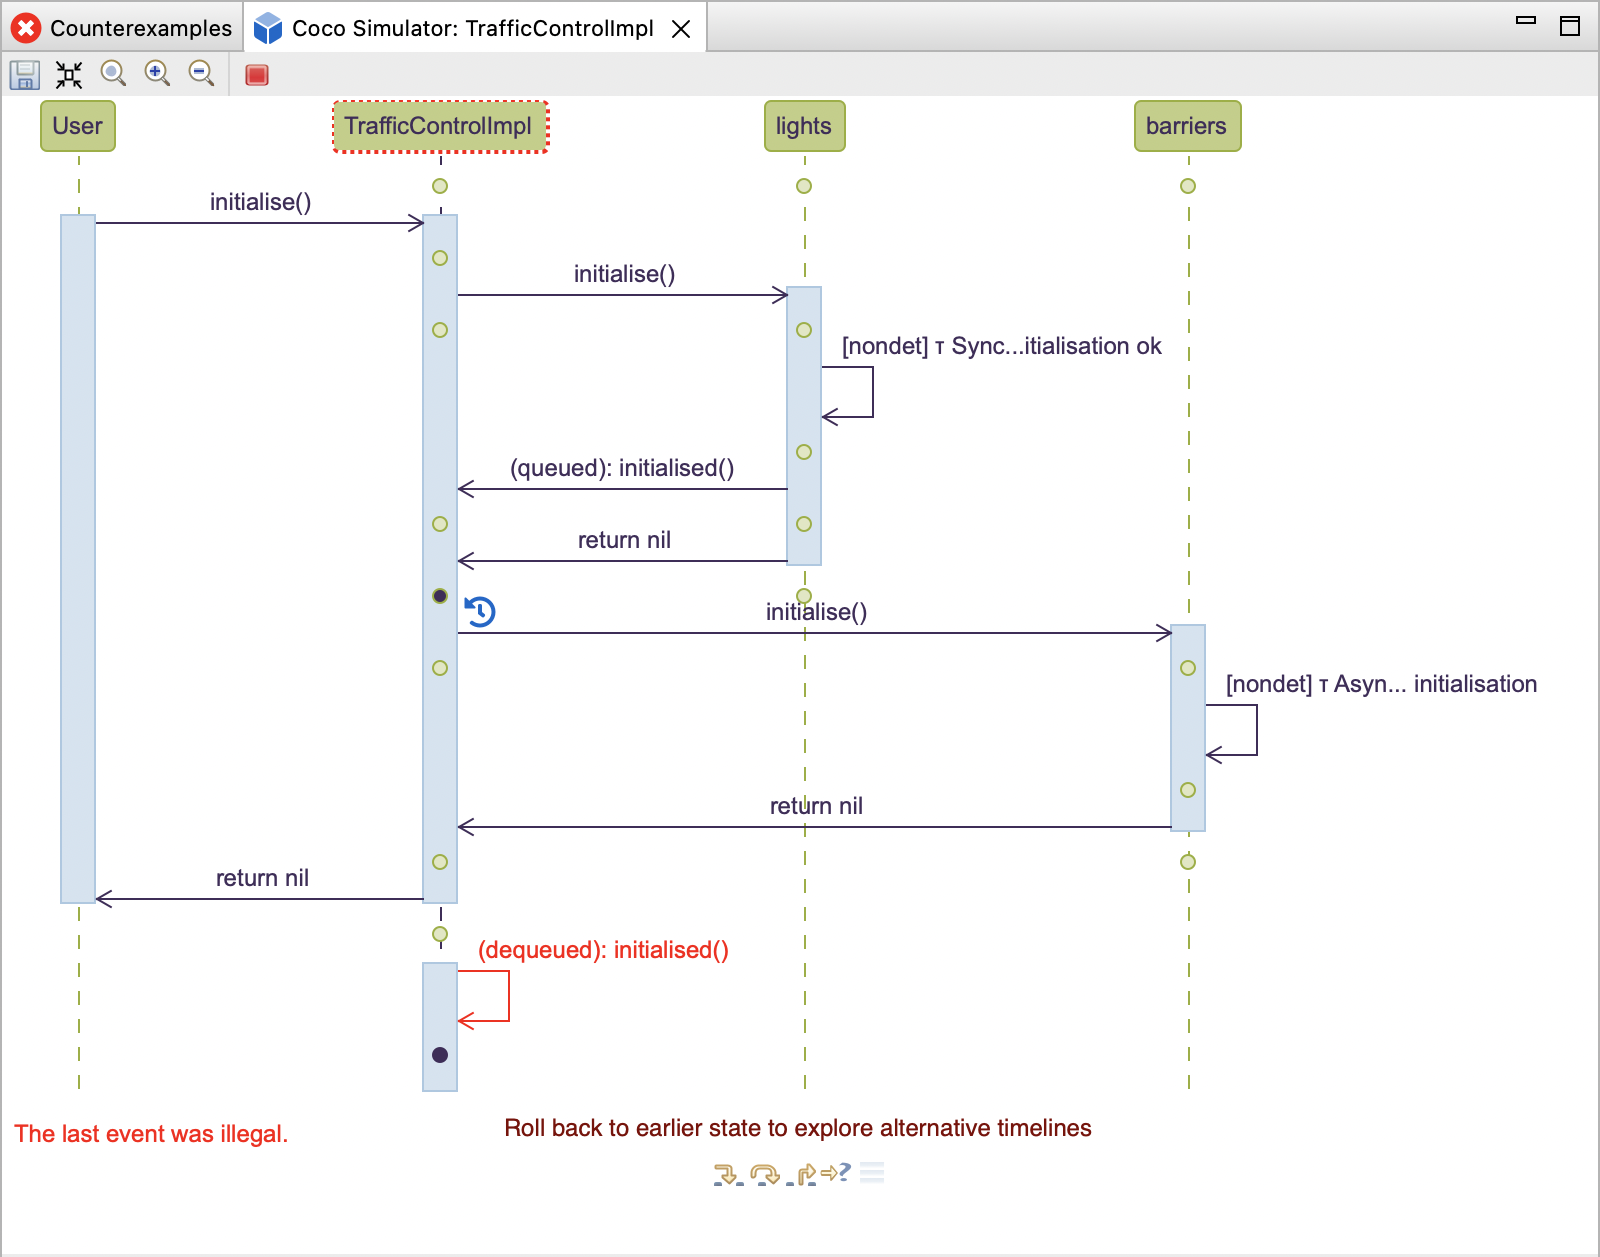
A counterexample can also be reopened in the simulator allowing you to explore alternative scenarios. To do this, either
click on  in the toolbar, and select the component or port instance in the dropdown list, or hover directly
over one of the swim lane labels and click on that appears next to it:
in the toolbar, and select the component or port instance in the dropdown list, or hover directly
over one of the swim lane labels and click on that appears next to it:
This will launch the Simulator view with the counterexample loaded. You can then use the Simulator for Coco in the normal way, for example by rolling back the simulation to an earlier state and exploring alternative paths to help understand and debug the error:
Remote Verification
Depending on your Popili Preferences settings, and the availability of the remote verification service, the verification will be run locally or remotely.
There are two main advantages of running the verification remotely. Firstly, the verification is CPU and memory intensive, and therefore large projects will be faster to verify using the remote verification due to the additional resources available. Secondly, the verification results are cached, and shared between all of members in your team who are working on the same project. This avoids rerunning the verification unnecessarily on projects that have already been verified. All changes made to any of the verification results, for example due to a change made by a team member to one of the Coco modules in the project, will be available to everyone else who has access to that project, and is also running the verification remotely.
Simulator for Coco
Popili’s simulator allows Coco port and component state machines to be interactively explored, where you can choose which event should be performed at each step. Further, you can also launch the simulator with a counterexample (generated by the verification), and explore alternative scenarios based on the counterexample.
To launch the simulator, right-click on a port or component in the Assertions view, and select
Simulate in the popup menu:
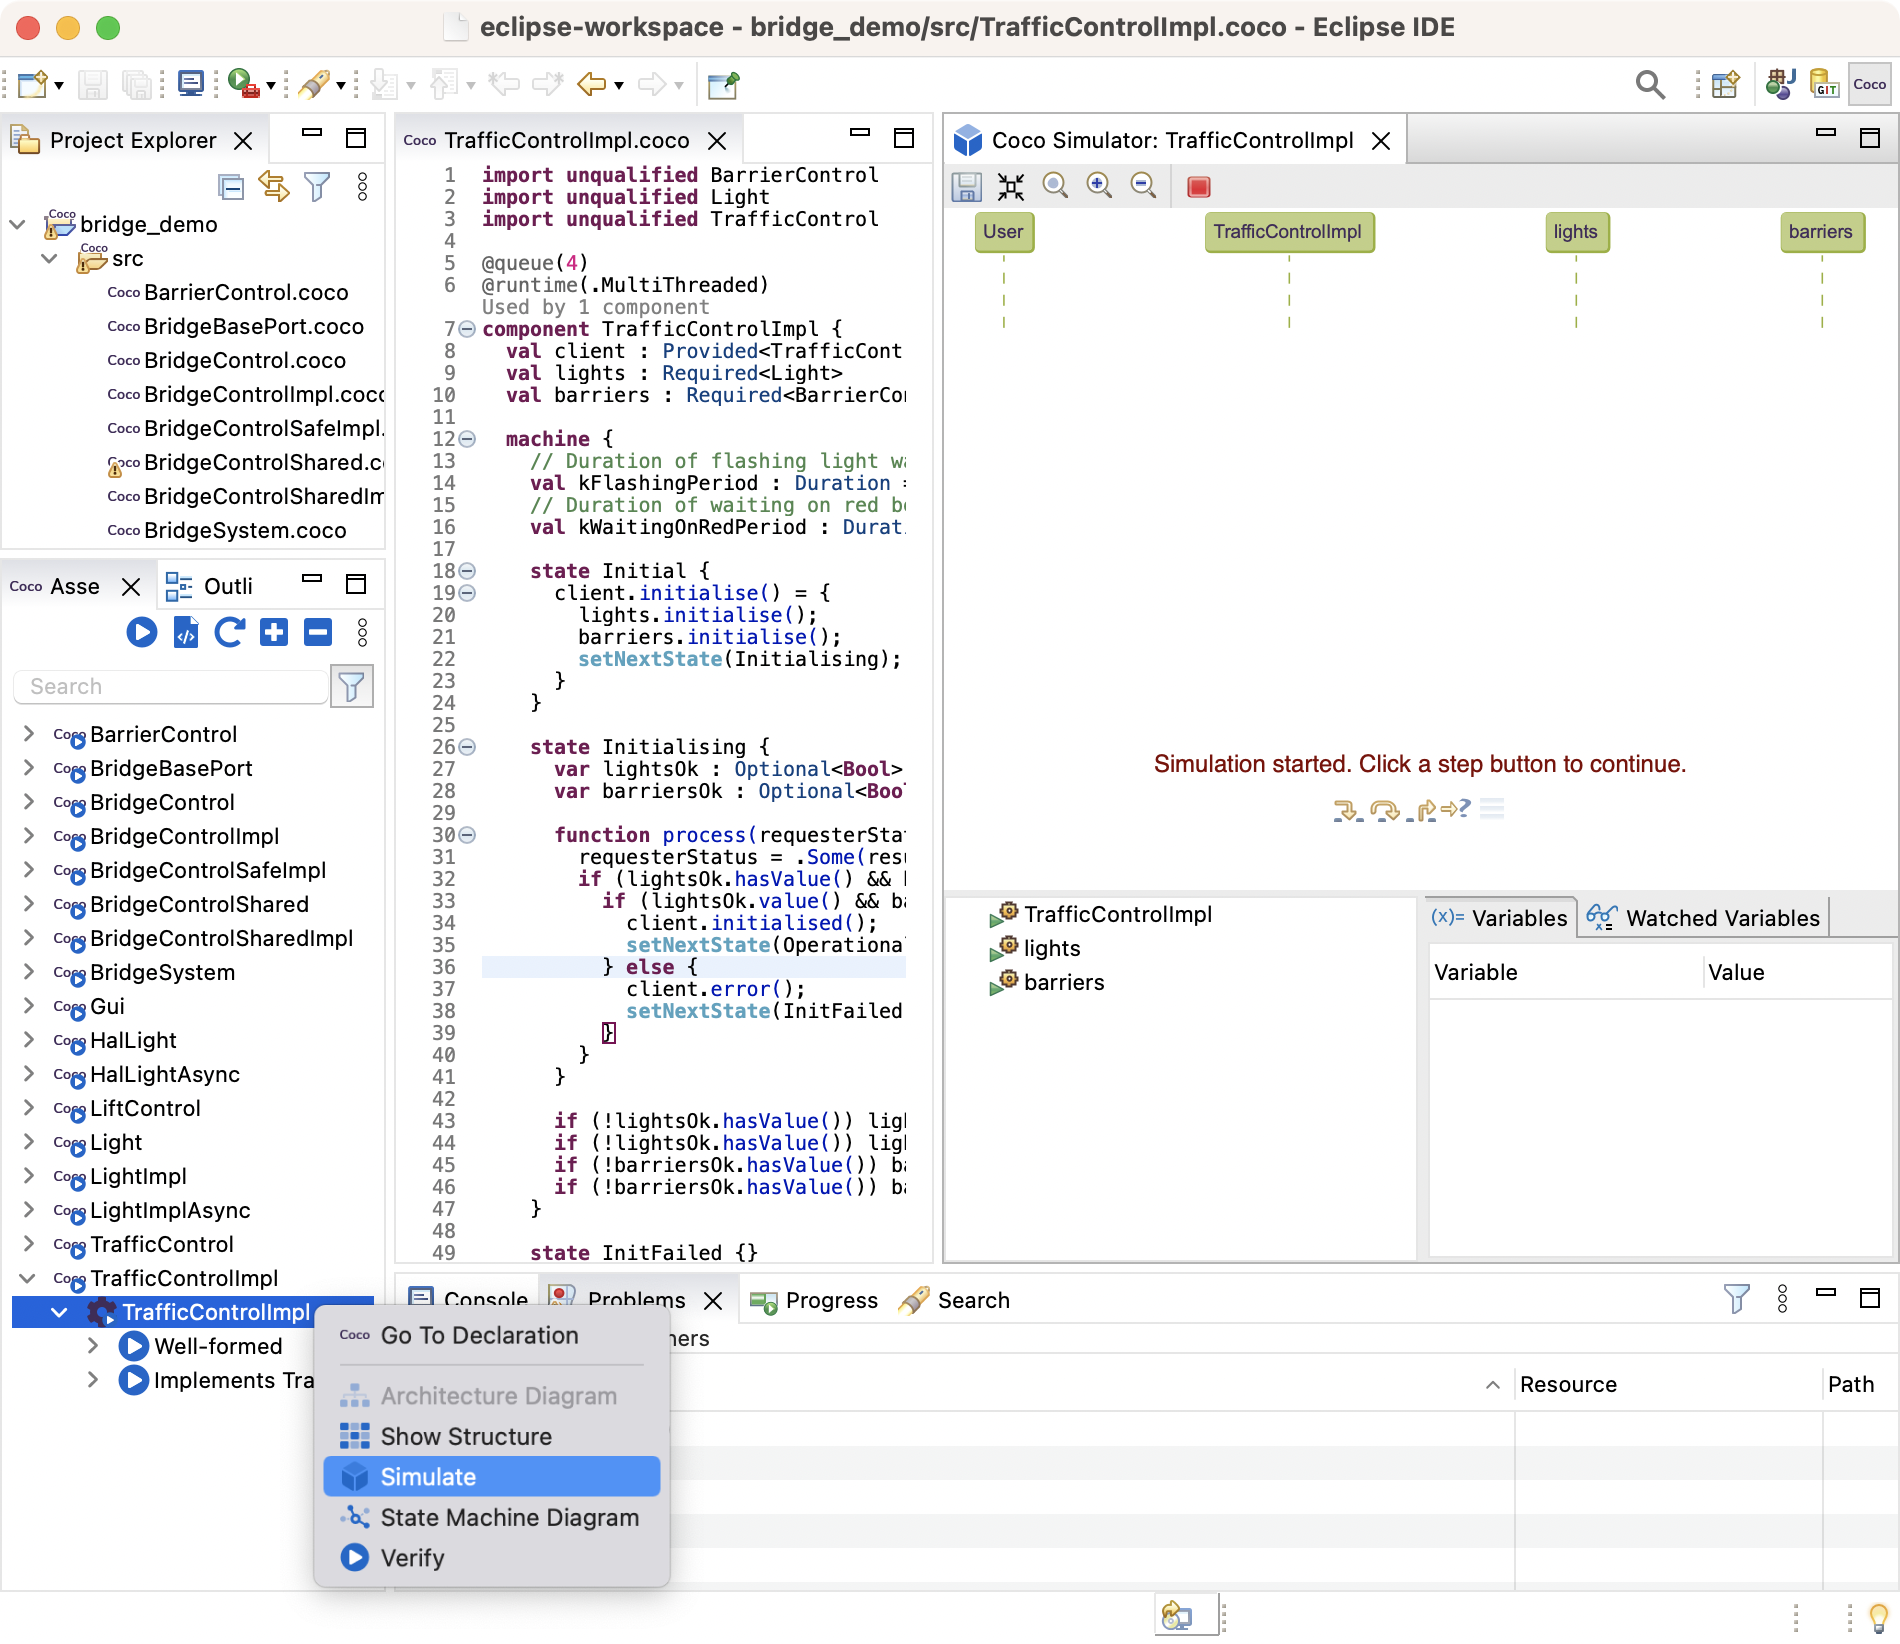
As illustrated above, the simulator is launched in the top pane of the Simulator view.
At the top of the pane, there is a toolbar with the following five buttons: the first one saves the sequence diagram
image to a file, the next three buttons enables you to zoom-in, zoom-out, and restore the view to its
original size, and the last button ( ) closes the current simulation being run.
At the bottom of the pane, the Simulator view has another toolbar for driving the simulator with the following buttons:
| Icon | Name | Meaning |
|---|---|---|

|
Step Into | Advances execution at the lowest instruction level of granularity, in particular stepping into any functions invoked. |

|
Step Over | Advances execution at a coarser statement/line level of granularity, in particular stepping past any functions invoked. |

|
Step Out | Advances until the current function/stack frame returns. |

|
Step to Event | Advances execution until the next externally visible event, for example a spontaneous transition or a call to a transition function on one of the components or ports. |

|
Select Next Event | Displays the event selector, so that you can choose the next spontaneous transition or transition function call to take place in the system. |
The first four buttons listed above are collectively referred to as the step buttons. Note that for Step Into and Step Over, the granularity does not always map exactly to the familiar instruction and line level step functions of a conventional debugger due to the restrictions in the underlying computation model of the simulation.
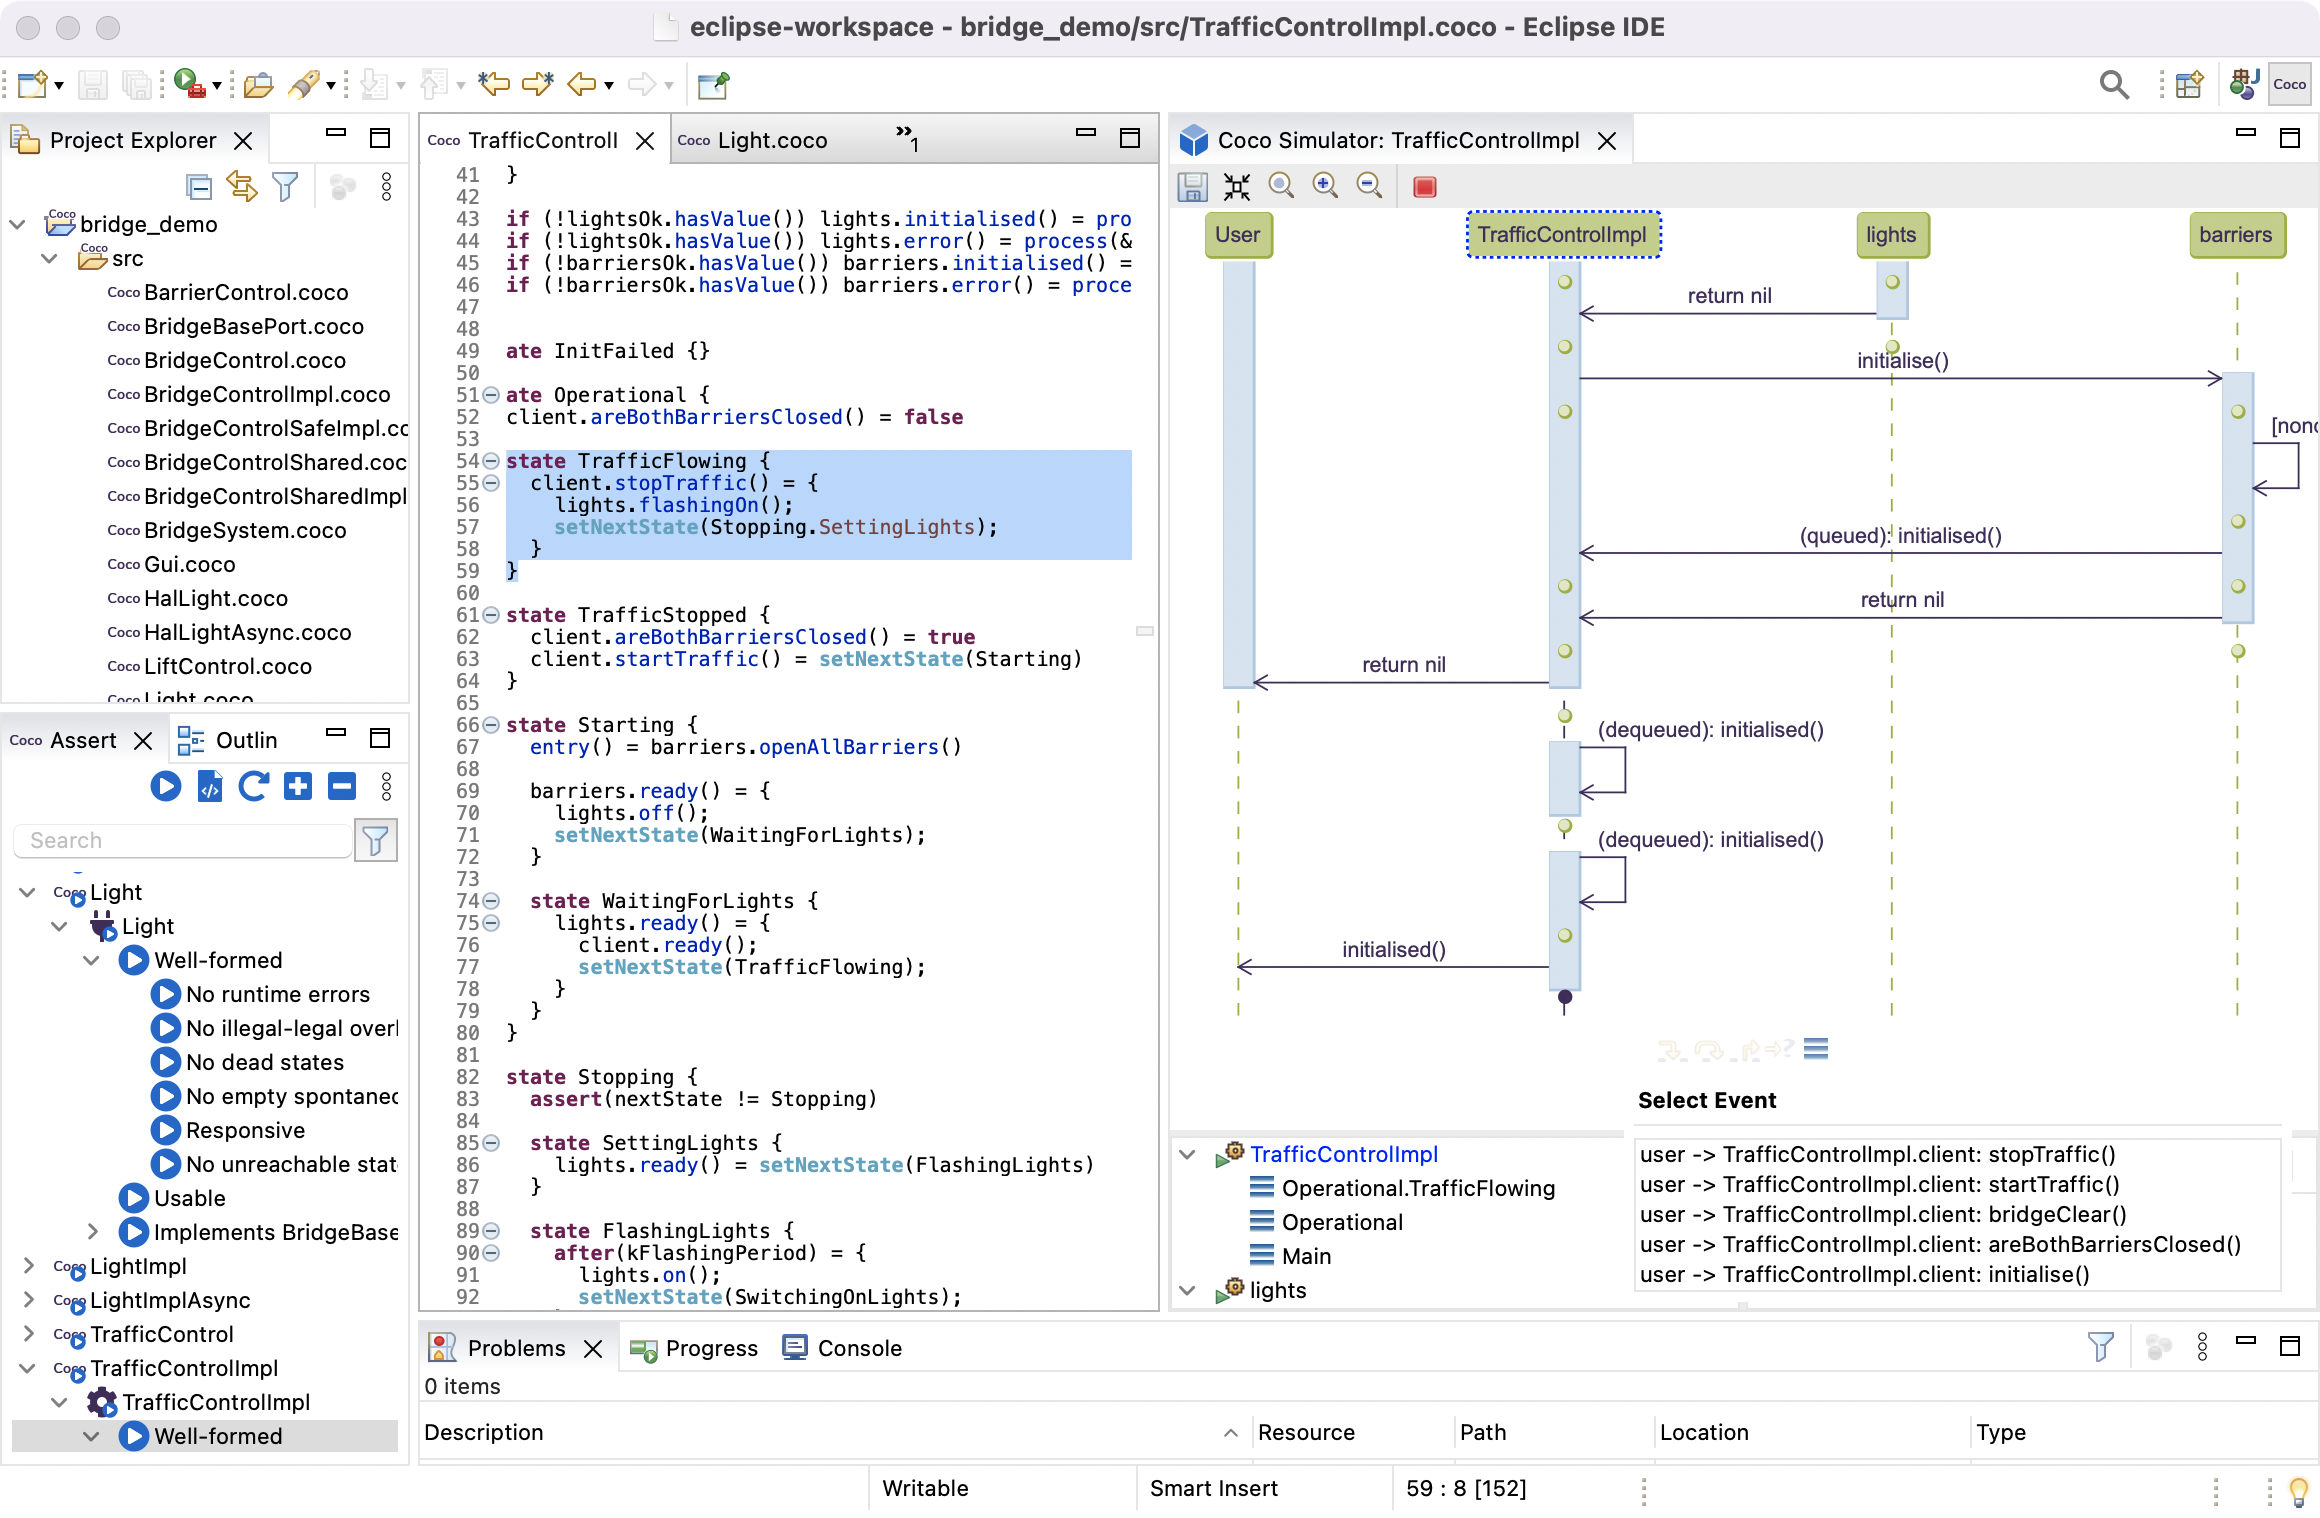
To get started, click on one of the step buttons (for example, ), which will cause the
event selector popup menu to appear listing the possible events that you can select. If more than one choice is displayed,
then these reflect different possible interleavings of events. Clicking outside the event selector will hide it, and
clicking causes it to be redisplayed. If the simulation has reached a state requiring you to choose an
interleaving, then the step buttons will be disabled until an event has been selected. You can change your mind
prior to continuing the simulation by redisplaying the event selector, and choosing a different event. To execute the
selected event, click on one of the step buttons.
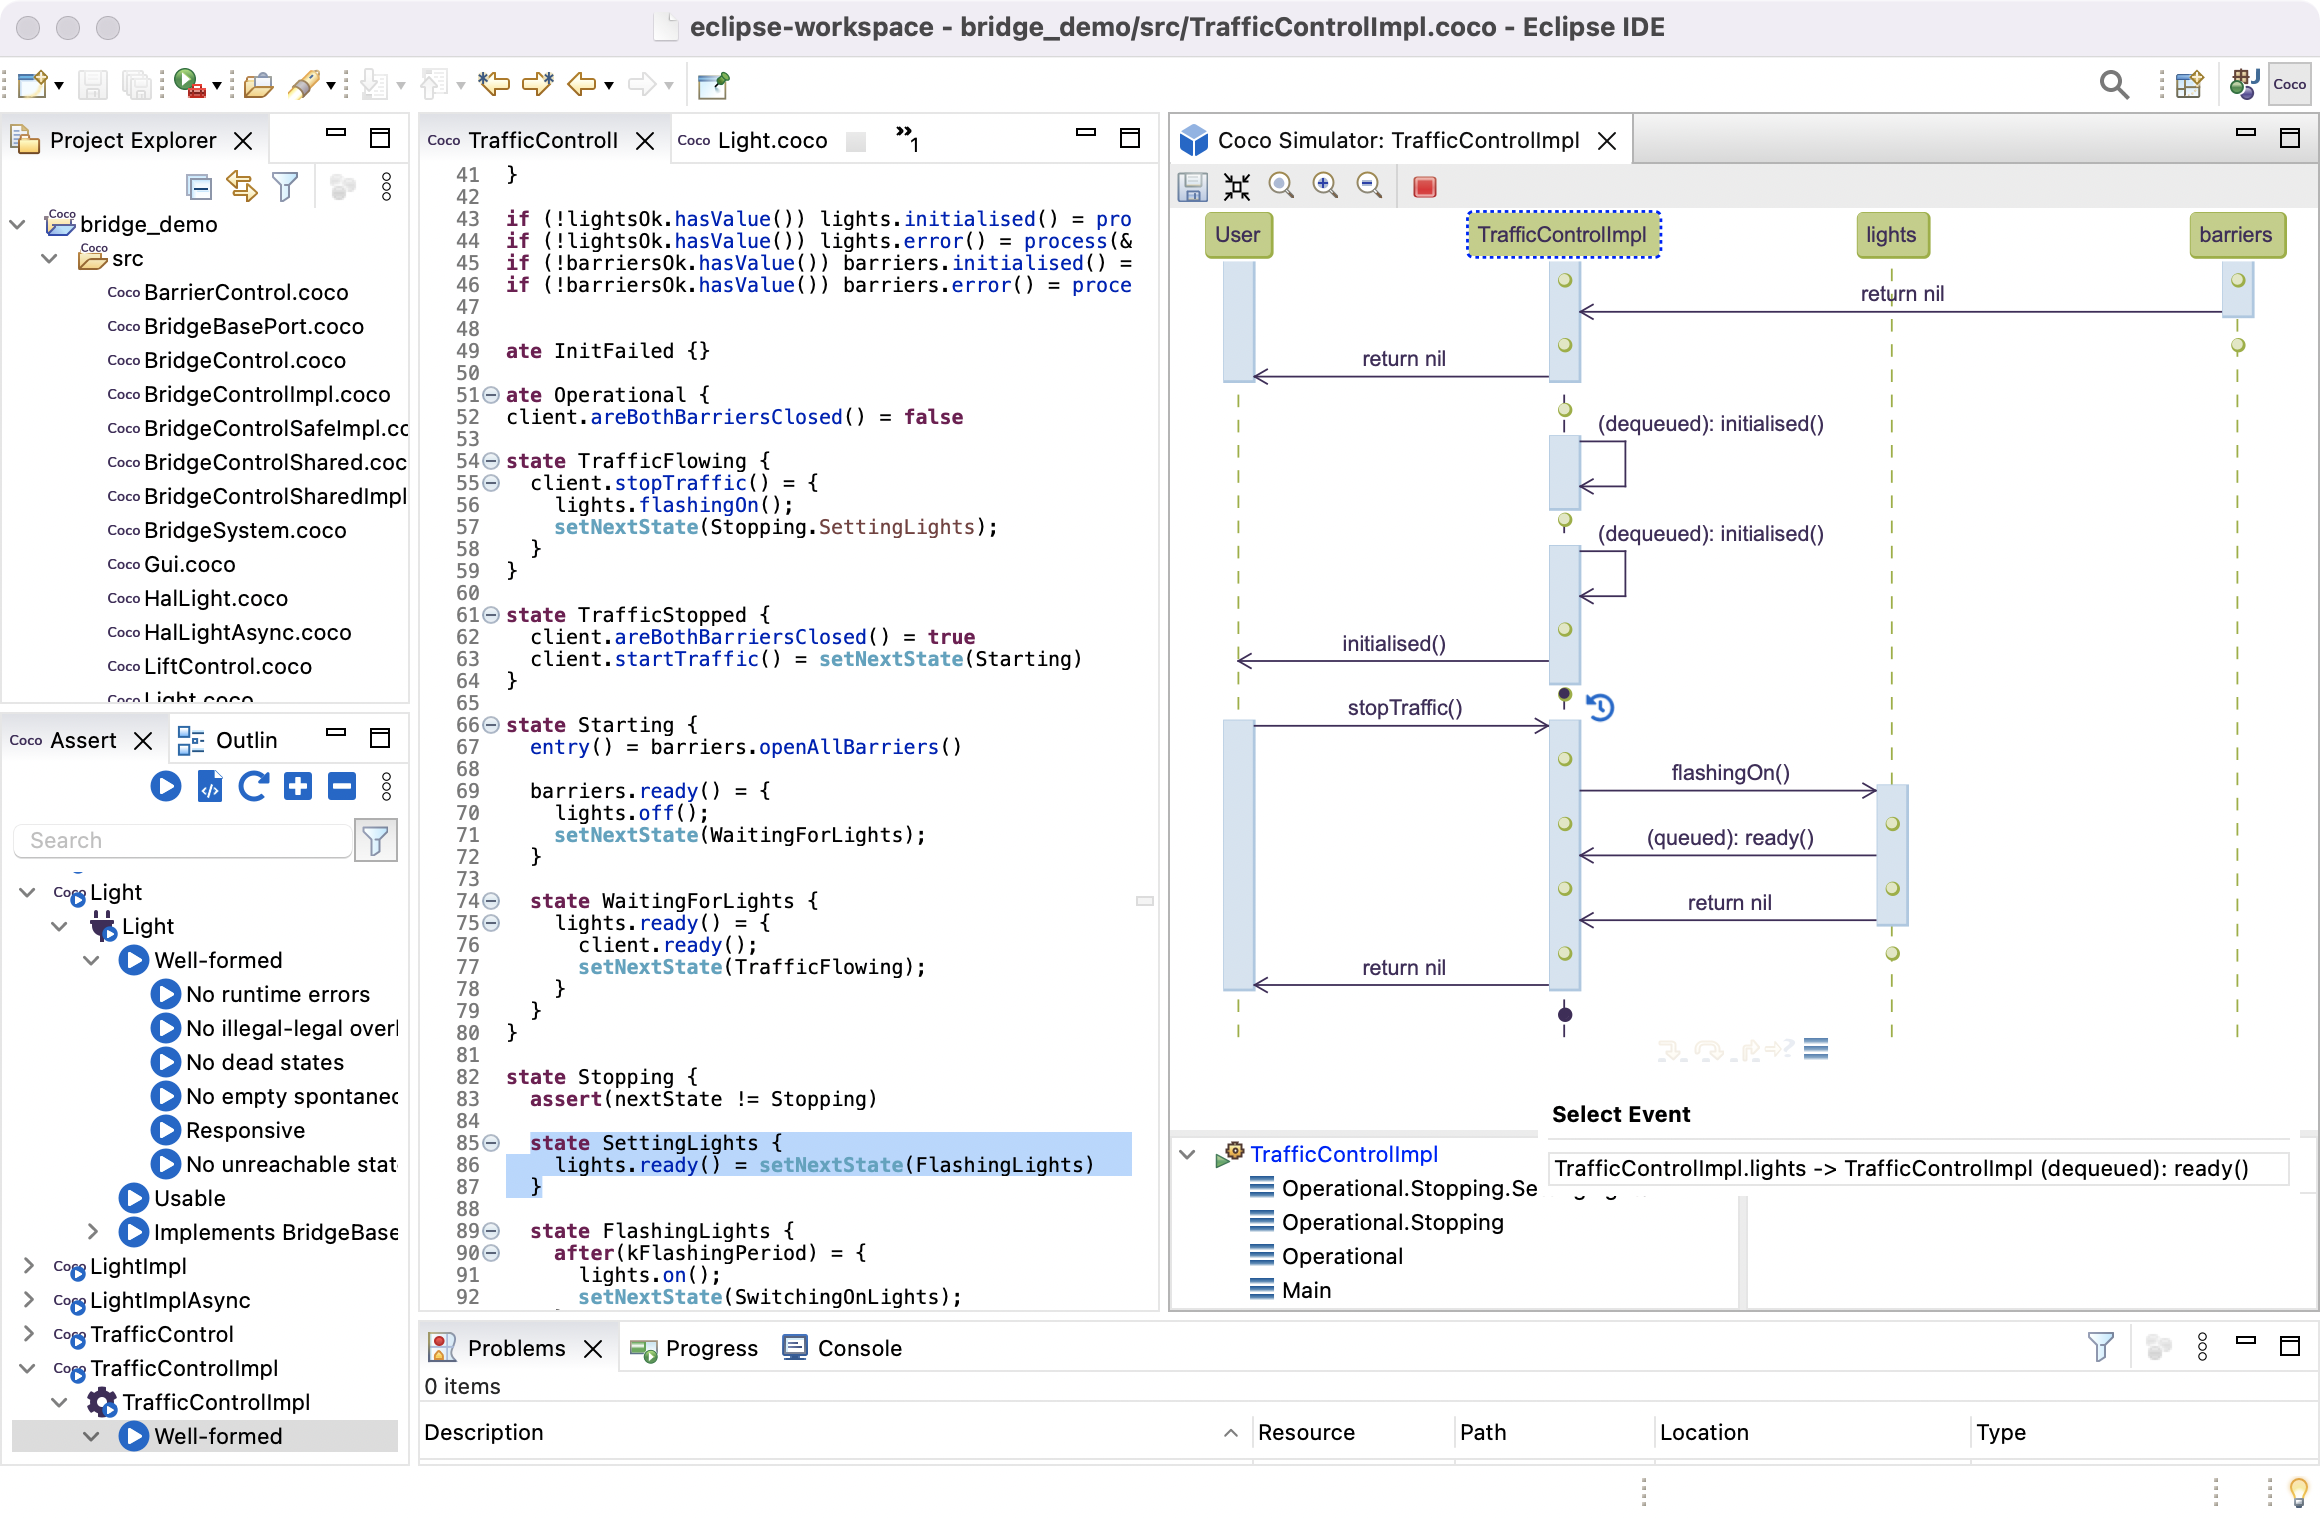
When clicking on one of the events in the event selector list, it will appear in blue in the sequence diagram, as illustrated below:
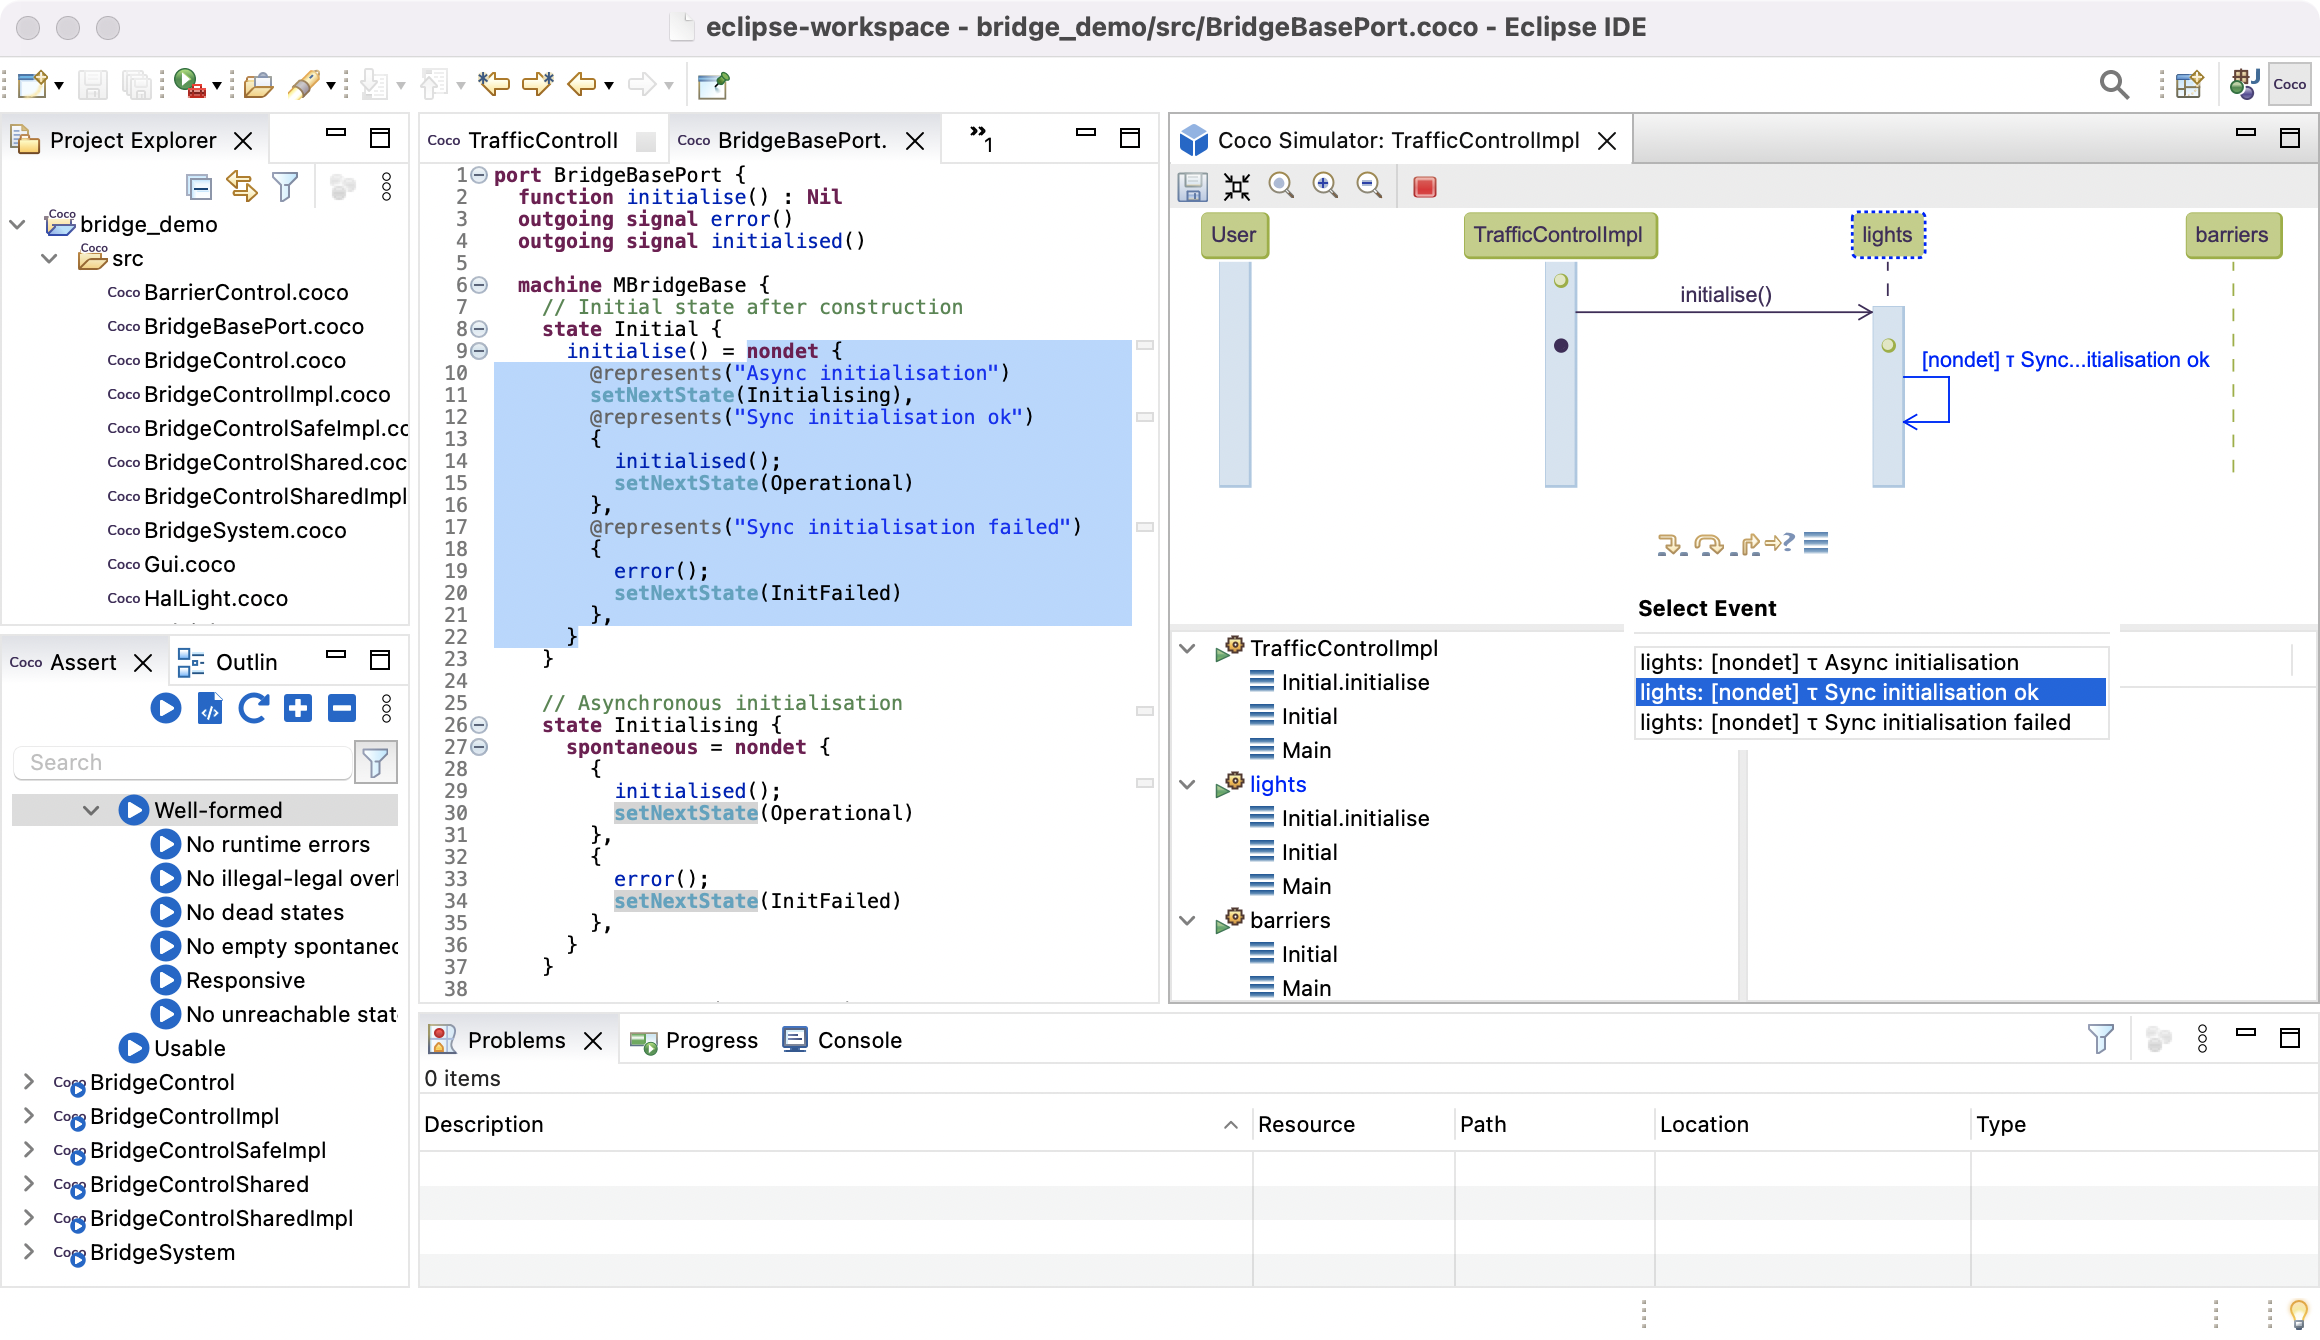
In the sequence diagram, the component or port state machine that is executed by each chosen step is highlighted with
a dashed blue line around the label of the corresponding swim lane. For example, the lights port instance is
highlighted in the example above, as it is currently executing the transition for the function initialise() previously
selected.
The bottom pane in the Simulator view displays the same additional debugging information as displayed in the
Counterexamples view. The two panes in the Simulator view are interactively linked to one another, and to the
Coco Editor view, as they are in the Counterexamples view. This means that the code corresponding to the most
recent step selected in the simulator is highlighted. In the example above, the lights port instance inherits the
initialisation behaviour it is currently executing from a base port called BridgeBasePort, which is highlighted
in the Coco Editor view.
At any point in the simulation, you can roll back the simulation to an earlier state in your sequence diagram, and
explore alternative scenarios. If you hover your curser over an earlier state in the sequence, the roll back icon
 will appear next to the state, as illustrated in the following example:
If you click on , then the simulator will roll back to this point in your simulation:
You can then continue stepping through different scenarios with the simulator in the normal way.
You can also select specific variables to watch while running the simulator, resulting in them being added with their respective values as annotations on every state in the sequence diagrm where they are in scope. See Watching Variables for further details.
Watching Variables
Popili allows you to select variables to watch in the Counterexamples View or Simulator for Coco, resulting in them being added as annotations, together their values, in the corresponding sequence diagram. The following example illustrates how this can be achieved when running the simulator:
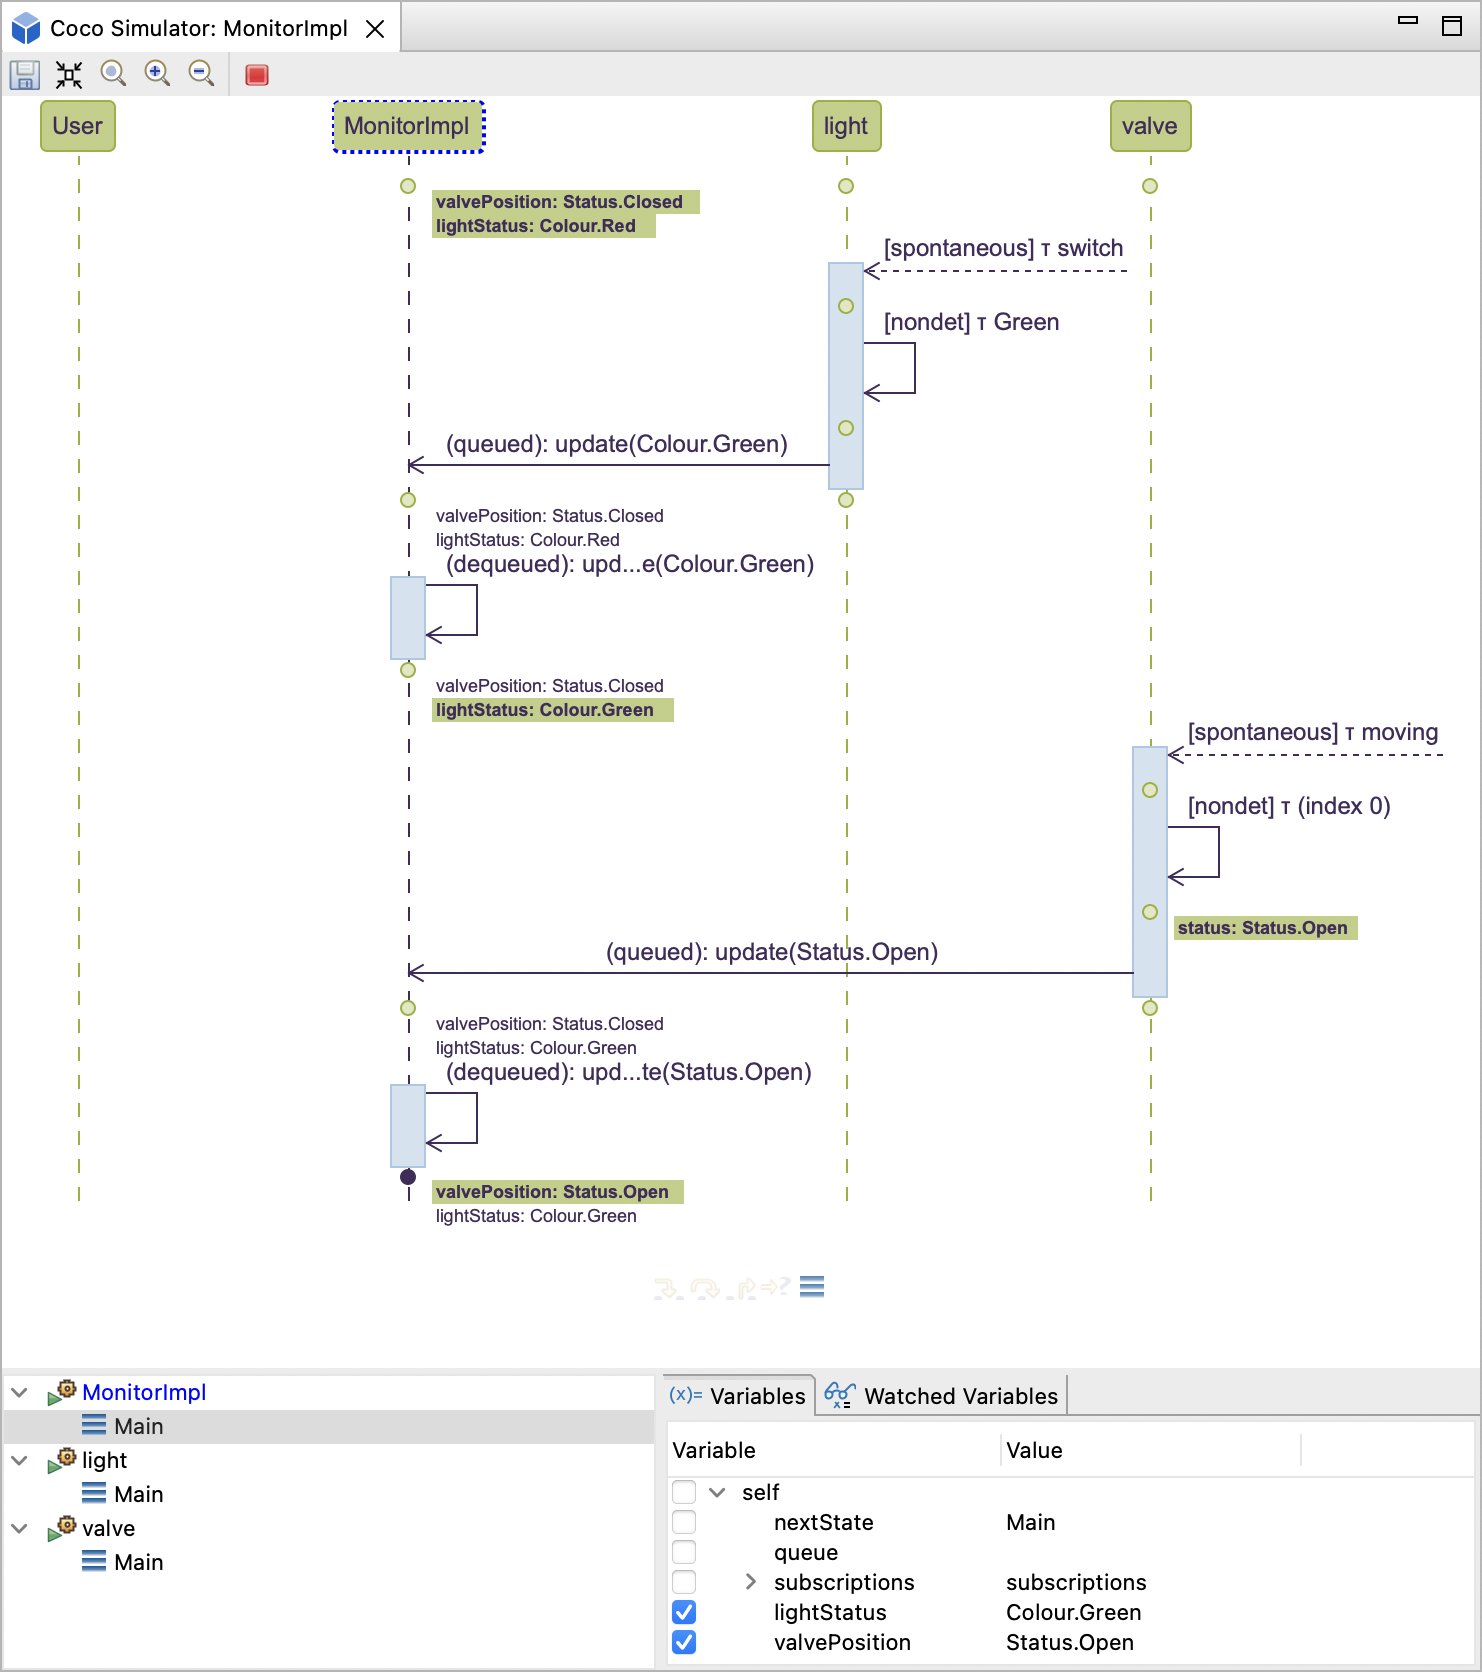
Variables are selected and deselected via the corresponding checkboxes in the variables tree, which can be found
under the first tab, labelled Variables, located at the bottom of the view. In the example above, the
variables lightStatus and valvePosition in the component MonitorImpl are selected, resulting in them being added
as annotations on every state in the sequence diagram to which they apply (i.e. where they are in scope). The annotation
is shown highlighted and in bold whenever a variable’s value changes.
The second tab, labelled Watched Variables, shows all watches for all components and ports. This allows you to toggle
them on and off easily without having to search the diagram to find where they are in scope. If they are not in scope,
then they are not visible in the variables tree. This is illustrated in the example above, where the lifeline for the
port valve is annotated with the variable status. Since the state selected is on the MonitorImpl lifeline, this
variable is not listed in the variable tree. However, it can be found in the list under the Watched Variables tab as
follows:
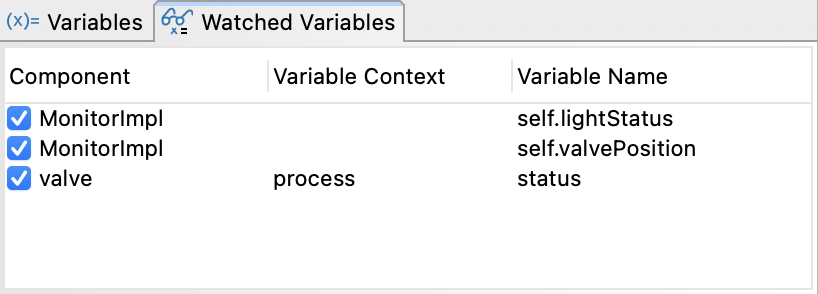
The first column shows the component or port instance as listed on the swim lanes in the diagram. The middle column
shows the enclosing scope of the variable: it will be blank for state machine variables, but will
show the name of the function if it is a local variable in that function. In the example above, the variable status
is a local variable in the function process. The last column in the table shows the variable
name with its full binding context.
This list remembers all of the variables that you have chosen to watch in the lifetime of the current counterexample or simulation. You can toggle the variables on and off as required, and the list is only cleared when the diagram is closed, or a new one is loaded.
Note
Values are only displayed for watched variables of primitive (or leaf) types, and not for complex nested structures or whole arrays. However, you can select individual elements of a structure or an array in the variables tree, and view the corresponding values in the sequence diagram.
Visualising Architectures
Popili allows you to automatically generate architecture diagrams for encapsulating components.
To generate these diagrams, right-click on an encapsulating component (denoted by ) in the
Assertions view, and select Architecture Diagram in the popup menu:
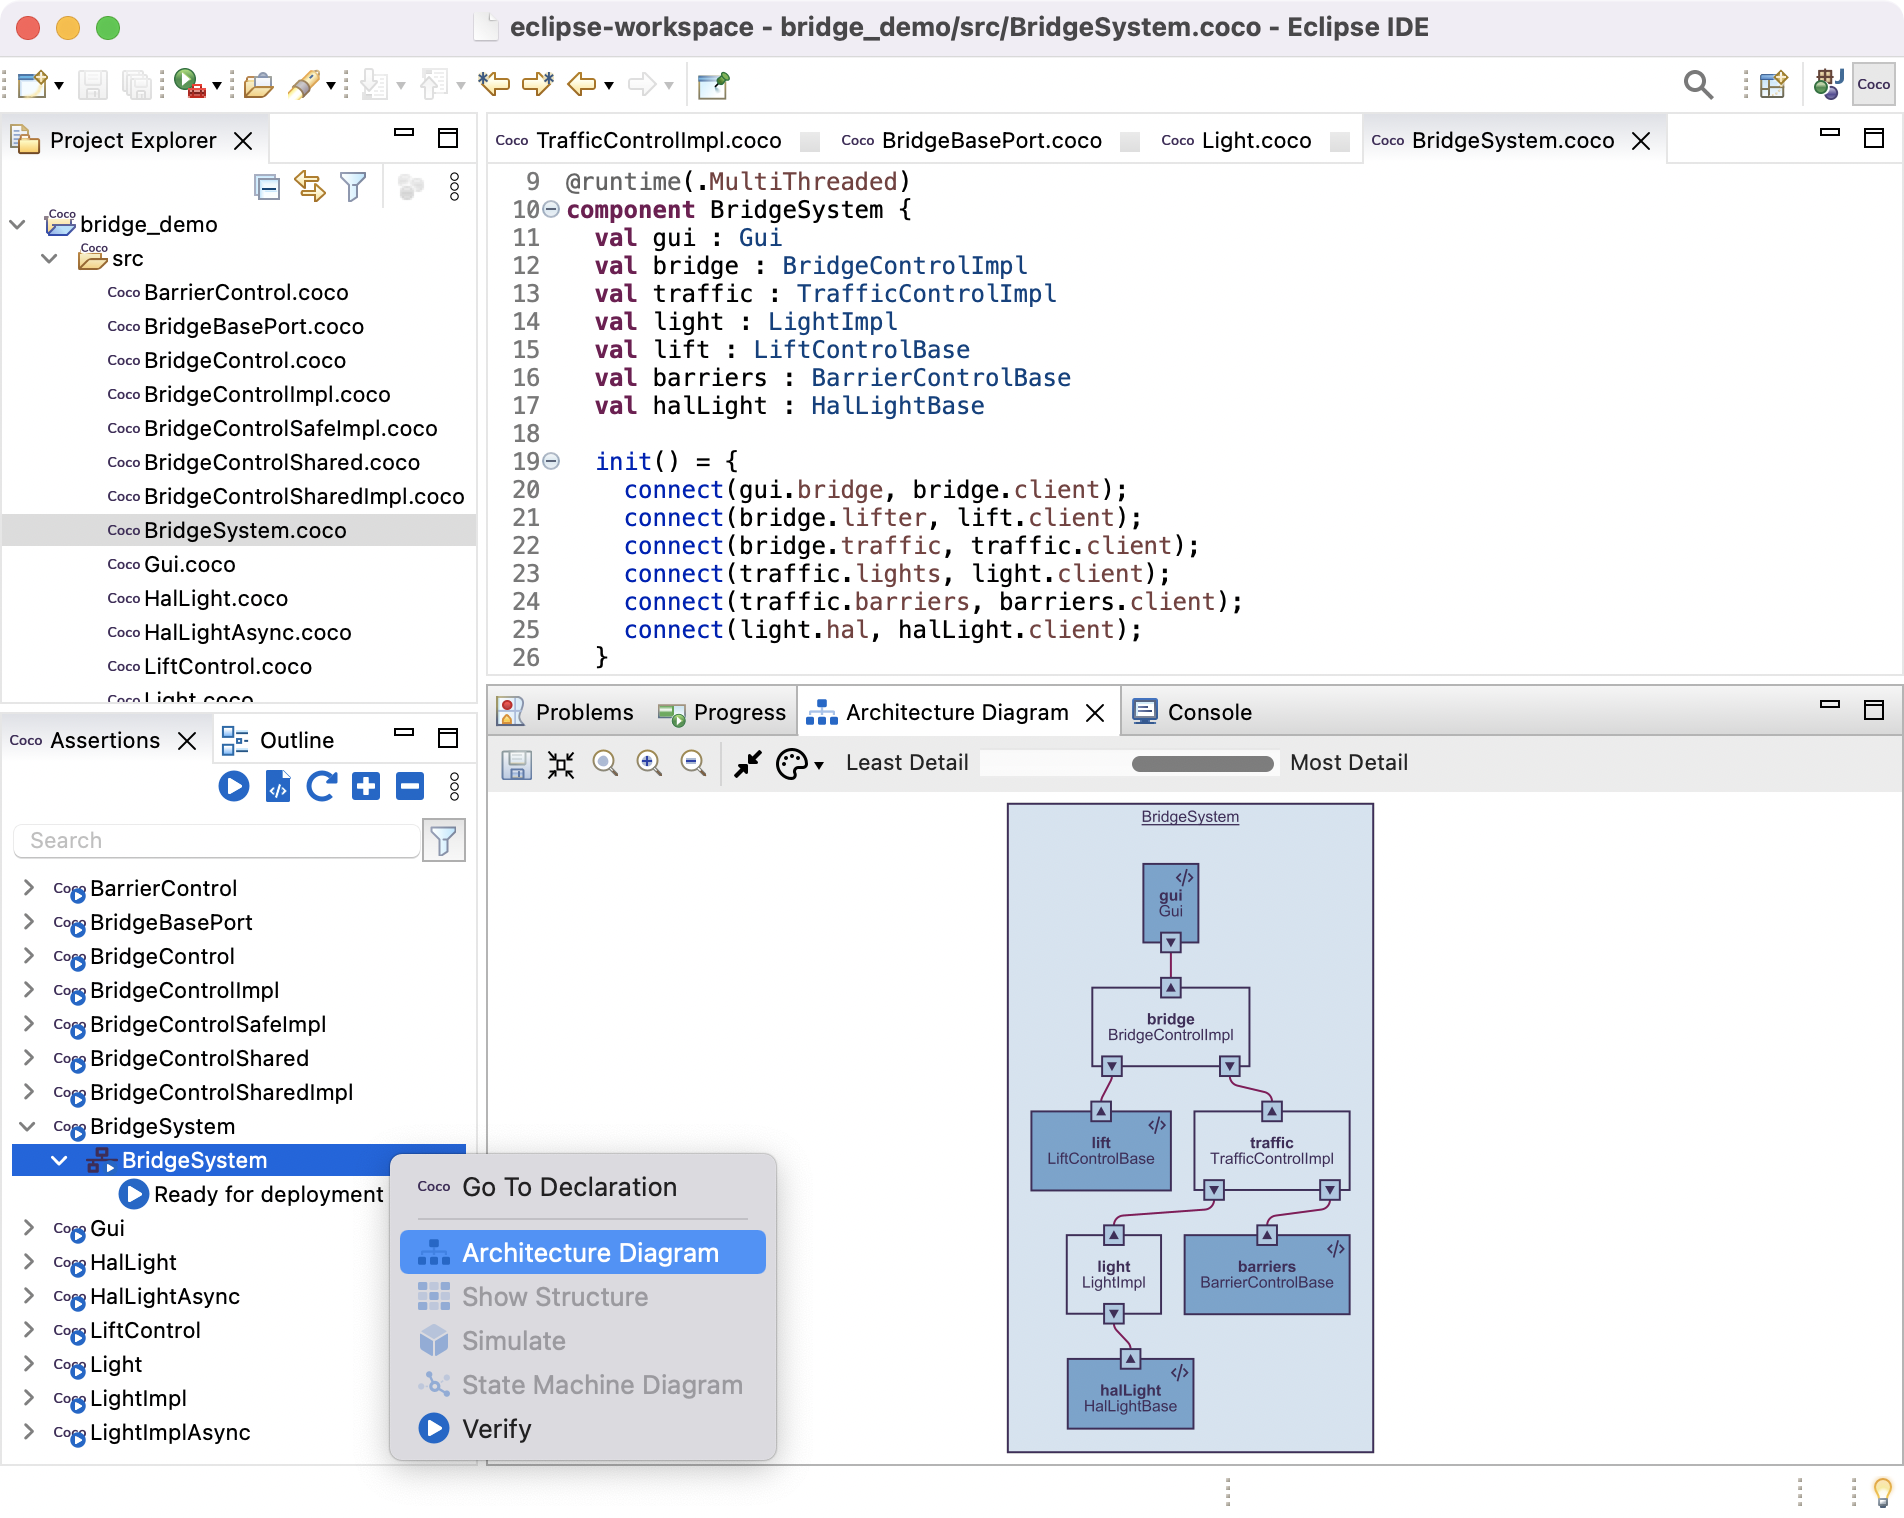
As illustrated above, the architecture is shown in the Architecture Diagram view. This graphical
representation displays all the components and ports declared in the encapsulating component, together with their
connections as specified in the constructor. The diagram also uses the colour conventions defined in the
Graphical Conventions section of the Coco Language Reference to denote
the runtime and type for each component. For example, in the diagram above, the colours and markings denote that
BridgeSystem is a multi-threaded encapsulating component consisting of a number of multi-threaded components within
it, where bridge is an example of an implementation component, and gui is an example of an
external component.
See also
Coco also supports multi-threaded encapsulating components consisting of single-threaded components within them. See Mixed Runtime for further details.
If you hover your cursor over any component or port in the architecture diagram, they will be highlighted in red, together with the ports they are connected to:
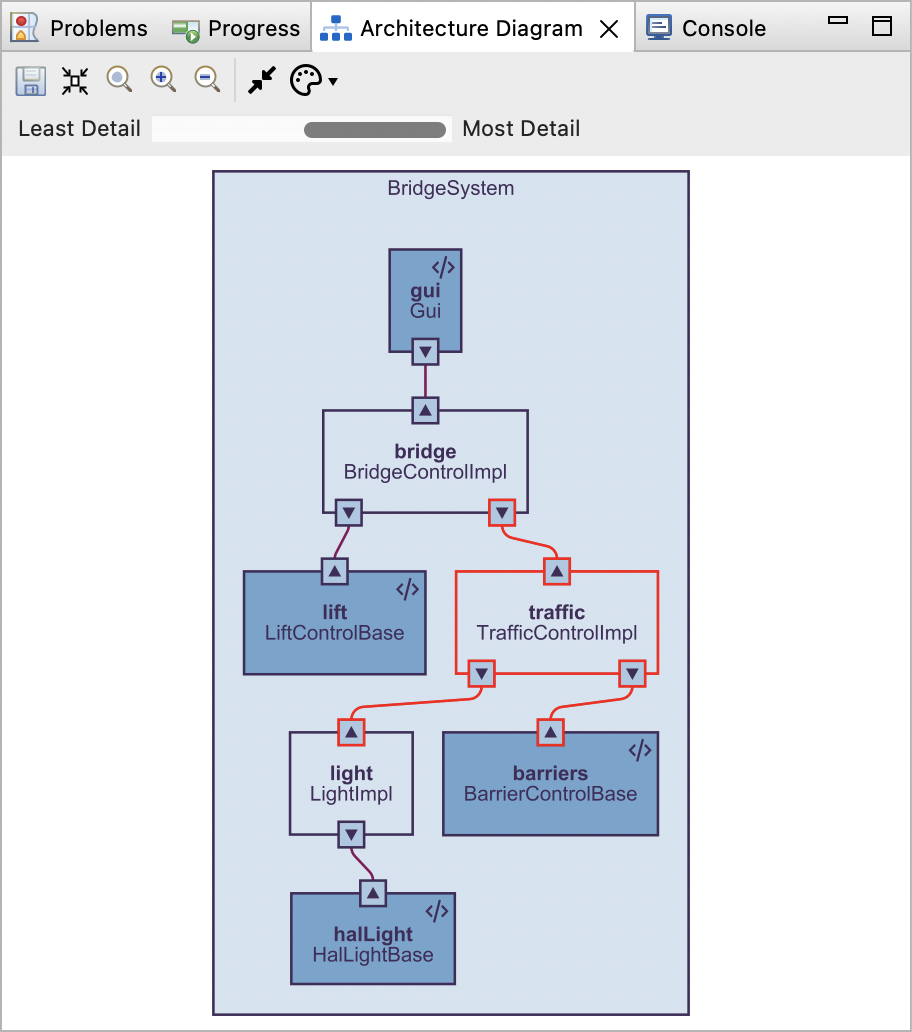
Further, if you click on any component or port in the diagram, the Coco module it is declared in will be opened in the Coco Editor, and its corresponding declaration will be highlighted.
The Architecture Diagram view’s toolbar provides you with the standard options for saving the diagram, setting the size of the image to fit within the existing view, and zooming in and out. It also provides the following three specialised options:
- Hide Ports: selecting this option results in the ports being hidden in the architecture diagram.
- Diagram Style Preferences: when clicking on this icon, a popup menu will appear where you can select whether to display component names, component types, port names, and port types in the architecture diagram.
- A slider ranging from Least Detail to Most Detail: this allows you to select the depth of component nesting to be displayed in the architecture diagram.
The Architecture Diagram view displays the most recently loaded architecture diagram, even when the project has been modified resulting in a potential change to the architecture. In this case, the Architecture Diagram view will be labelled with the text Diagram is out-of-date.
Visualising State Machines
Popili allows you to automatically generate different views of your port and component state machines, the choice of which depends on the information of interest. One of the views is a graphical representation of a port or component state machine, which provides an easy way to visualise all the states and see the transitions between them. An alternative view of a Coco state machine is provided by the Structure Viewer, which provides an easy way to see a summary of which events are allowed in which states. Each view is described in turn below.
State Machine Diagram
To generate the graphical representation of a port or component state machine, right-click on any port or component in the Assertions view, and select State Machine Diagram in the popup menu:
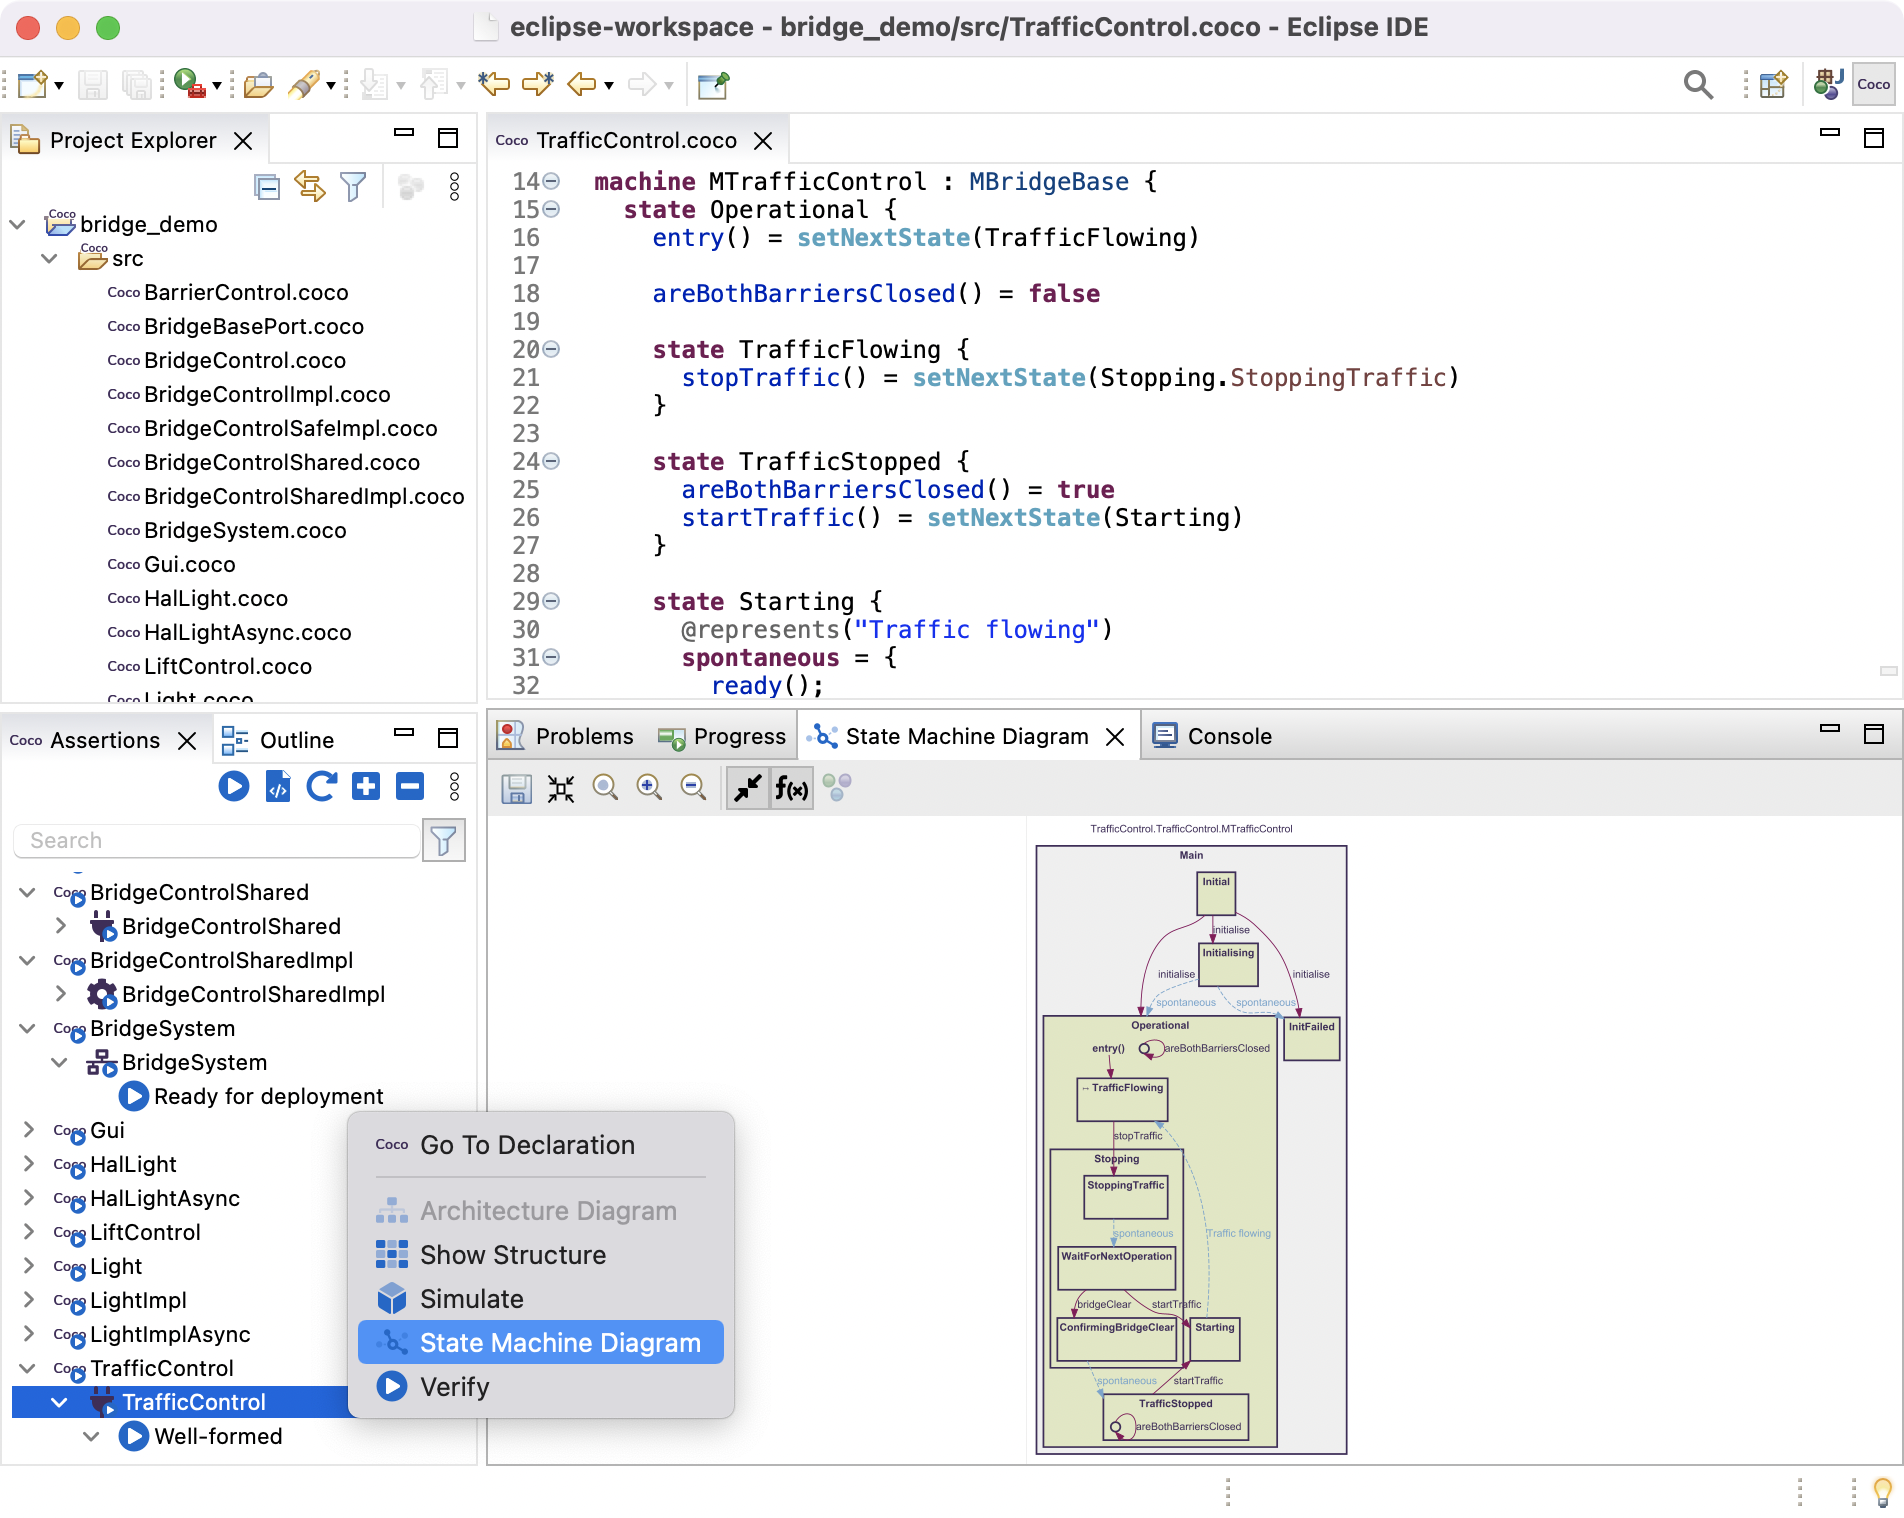
As illustrated above, the state machine diagram is shown in the State Machine Diagram view. This graphical
representation displays all of the states declared in a Coco state machine as rectangular nodes that are
labelled with their corresponding state identifiers. The state hierarchy is also preserved in the graph; for example,
the node labelled Stopping is displayed within the node labelled Operational, which means that
Stopping is declared as a nested state within the Operational state in the corresponding Coco.
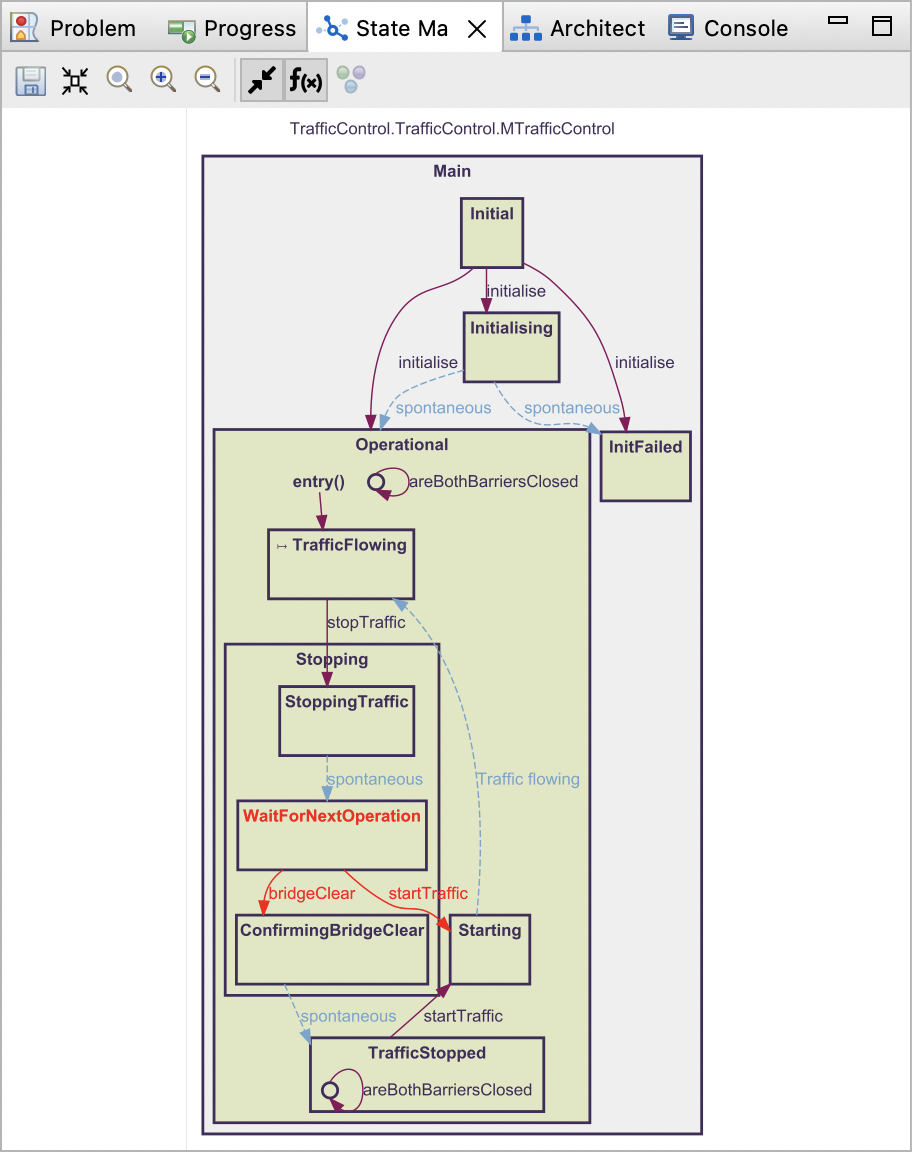
The state machine diagram also displays all of the transitions declared between the states as directed edges between the
nodes. These edges are either labelled with their corresponding event names, or with the labels specified in the
@represents attribute where relevant.
If you hover your cursor over any states or transitions in the state machine diagram, they will be highlighted in red. For a transition, the corresponding source and destination are also highlighted; and for a state, the transitions declared in it are highlighted, as illustrated in the following example:
Further, if you click on any state or transition in the diagram, the modules they are declared in will be opened in the Coco Editor and their corresponding declarations will be highlighted.
The State Machine Diagram view’s toolbar provides you with the standard options for saving the diagram, setting the size of the image to fit within the existing view, and zooming in and out. In addition, it also provides the following two specialised options:
- Expand/Collapse Edges: This option allows you to choose between an expanded representation of the graph, where there is an individual directed edge for every transition declared between two states, or a collapsed representation where all of the event names of the transitions between the same two states are displayed in a list on a single directed edge.
- Show/Hide Edge Labels: This option allows you to display or hide the labels on the graph edges.
By default, the state machine diagram is shown with the edges collapsed and labelled.
The State Machine Diagram view displays the most recently loaded state machine diagram, even when the project has been modified resulting in a potential change to it. In this case, the State Machine Diagram view will be labelled with the text Diagram is out-of-date.
Structure Viewer
Popili allows you to automatically generate a structured view for port and component state machines, which provides an easy way to see a summary of which events are allowed in which states.
To launch the Structure Viewer, right-click on any port or component in the Assertions view, and select Structure Viewer in the popup menu:
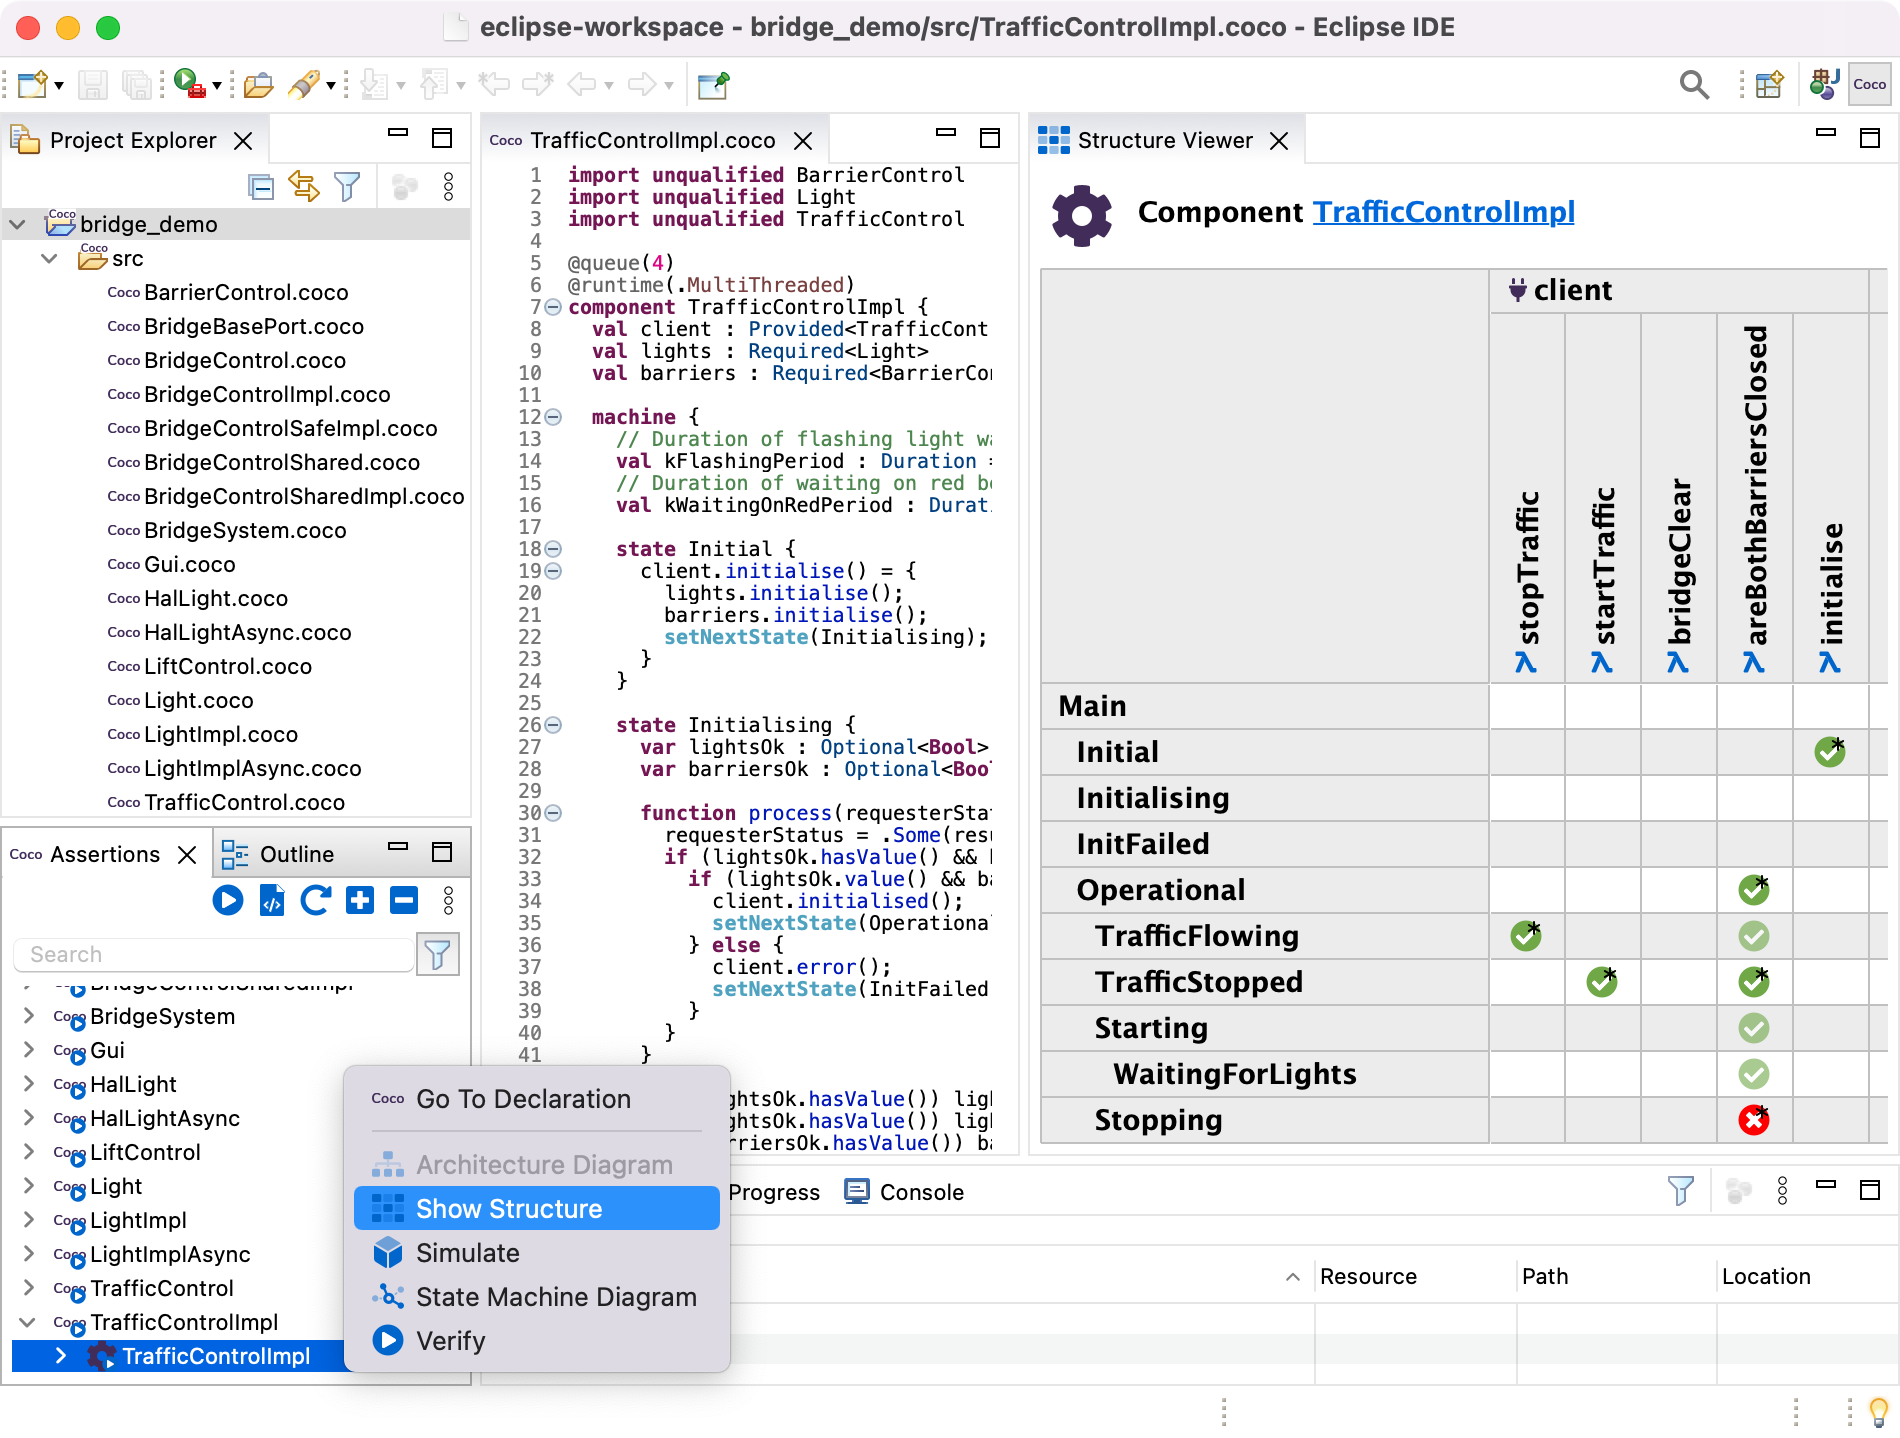
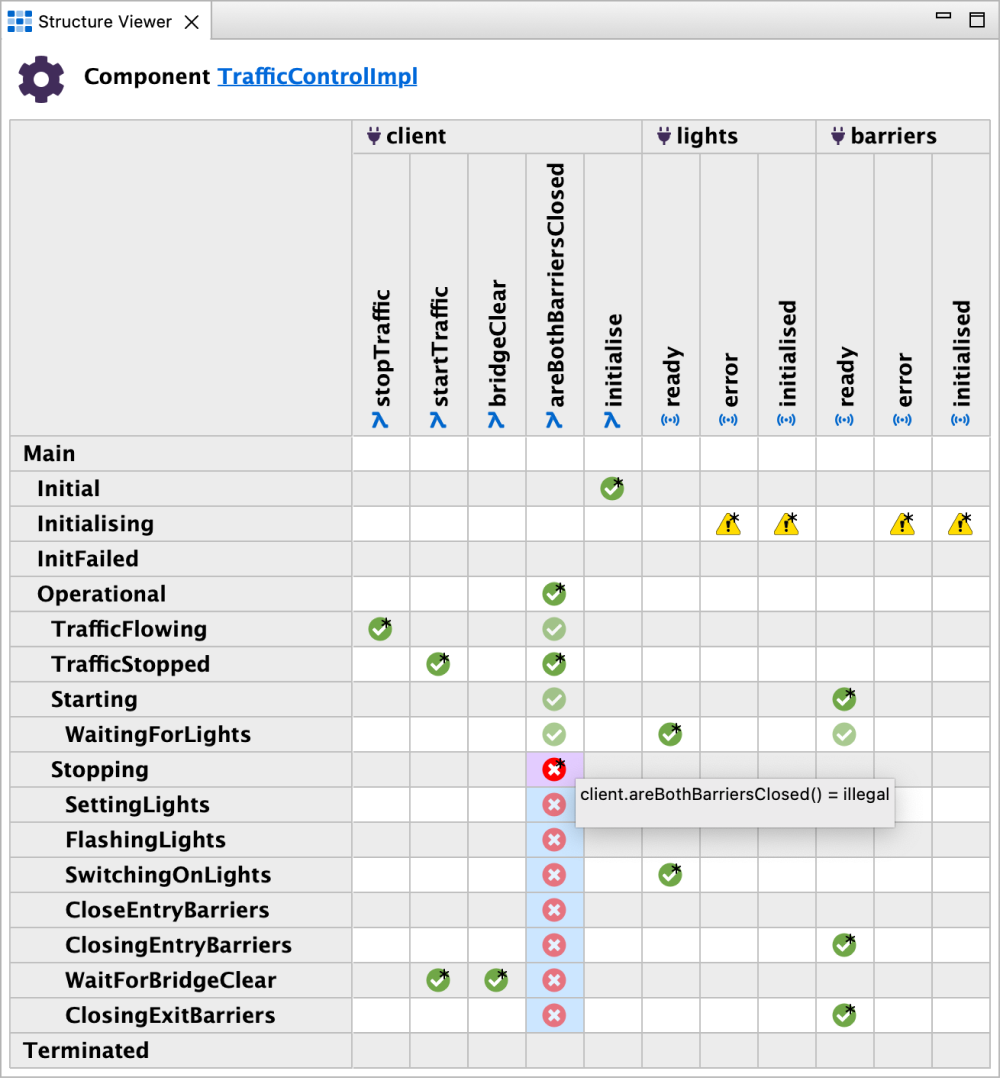
The complete structure view for the TrafficControlImpl component state machine is as follows:
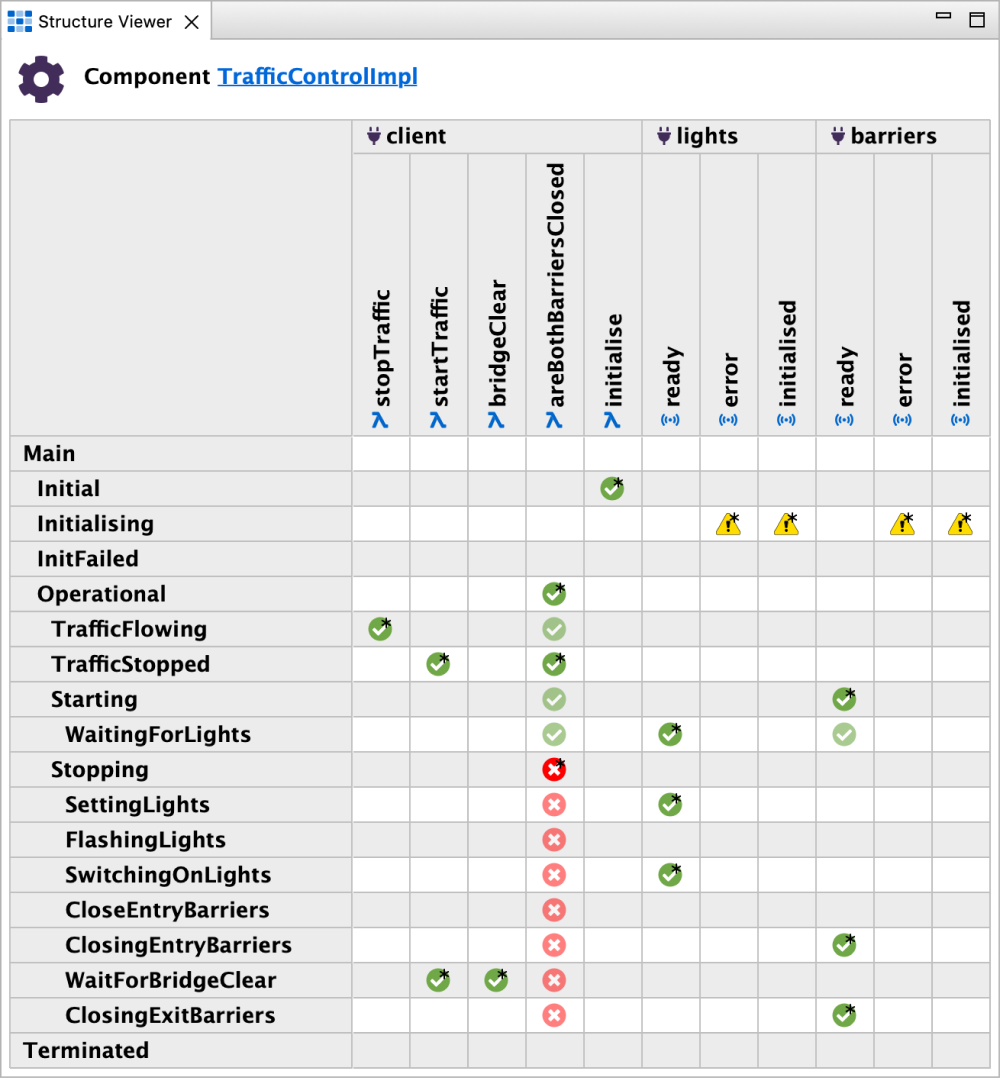
The states are listed in the first column, and are indented to reflect the state hierarchy. The top two rows list the function calls that can be called on components or ports, and in the case of components only, the signals that they can receive. The signals are listed under the required ports from which they originate. For every event and state pair in the structure viewer, either the entry is blank, indicating that no transition is declared for this event in this state, or it has one of the following icons:
| Icon | Meaning |
|---|---|

|
A legal transition for this event is declared, and is therefore allowed in this state. |

|
This state inherits a legal transition for this event declared in a parent state. |

|
This event is explicitly declared as illegal in this state. |

|
This state inherits a transition for this event declared in a parent state, which explicitly declares it
as illegal. |

|
A transition has been conditionally declared (for example, a guarded transition), and therefore may or may not be enabled in this state. |

|
This state inherits a conditional transition for this event declared in a parent state, and therefore may or may not be enabled in this state. |
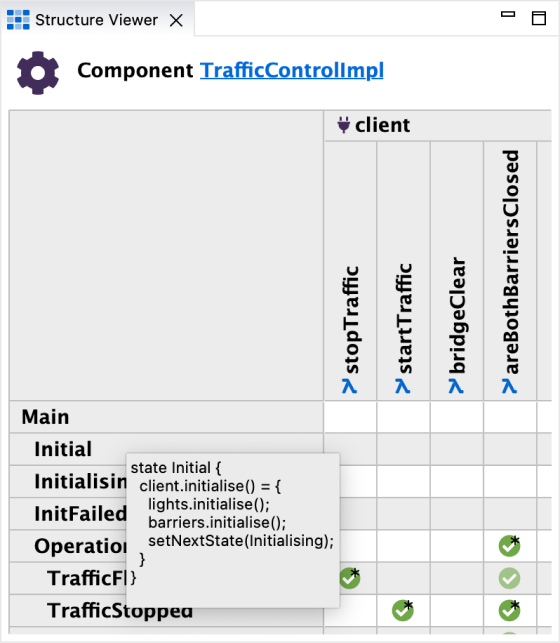
If you hover over any state listed in the structure viewer, a tooltip will appear displaying the state’s declaration:
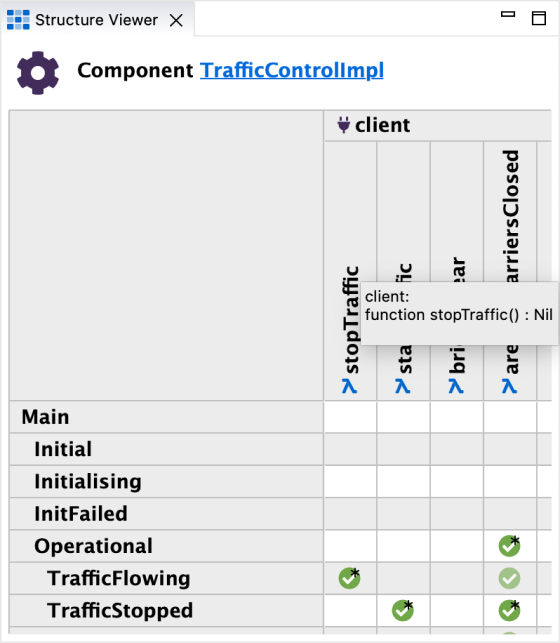
Similarly, if you hover over any event listed, a tooltip will appear displaying the event’s declaration, together with the port instance within which it is declared:
You can also hover over any of the icons in the structure viewer, and see a tooltip displaying the corresponding transition declaration, as well as additional cell highlighting to differentiate between the states where the transition is declared (highlighted in pink) versus those that inherit the transition from parent states (highlighted in blue):
The Structure Viewer displays the most recently loaded version, even when the project has been modified resulting in a potential change to it. In this case, the Structure Viewer view will be labelled with the text Diagram is out-of-date.
Generating Code
Once your Coco project passes all of the verification checks, you can automatically generate the code in one of the target programming languages supported by Popili either by:
- Clicking on in the Assertions view menu; or
- Right-clicking on your project in the Project Explorer view, and selecting Popili → Generate Code from the popup menu.
The code will be generated in the subfolder generated within your project. If the folder does not already exist, it will be automatically generated.
See also
For details on how to customise the code generated by Popili, see Packages and Code Generation Options.
Creating a Support Bundle
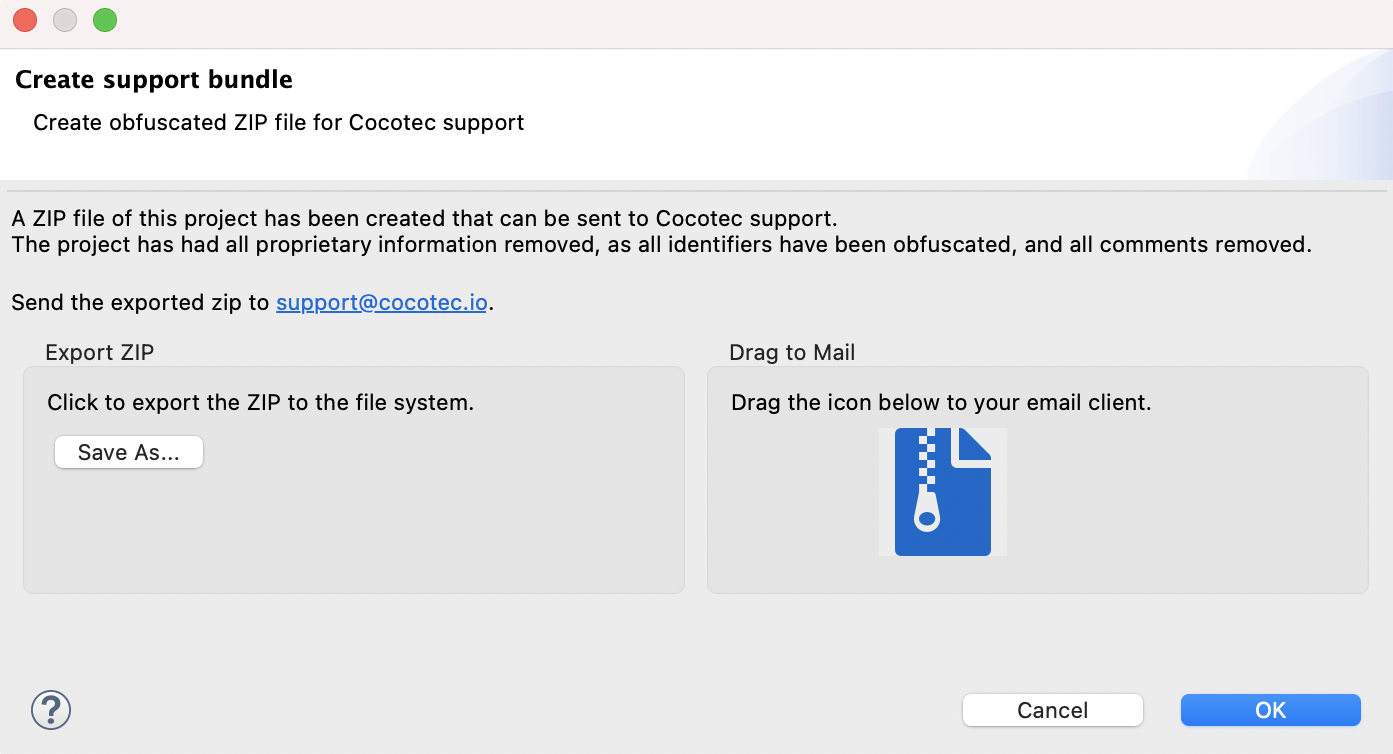
You can create an obfuscated ZIP file of a Coco project, for example to send to Cocotec support, where all proprietary information is removed, all identifiers are obfuscated, and all comments are removed.
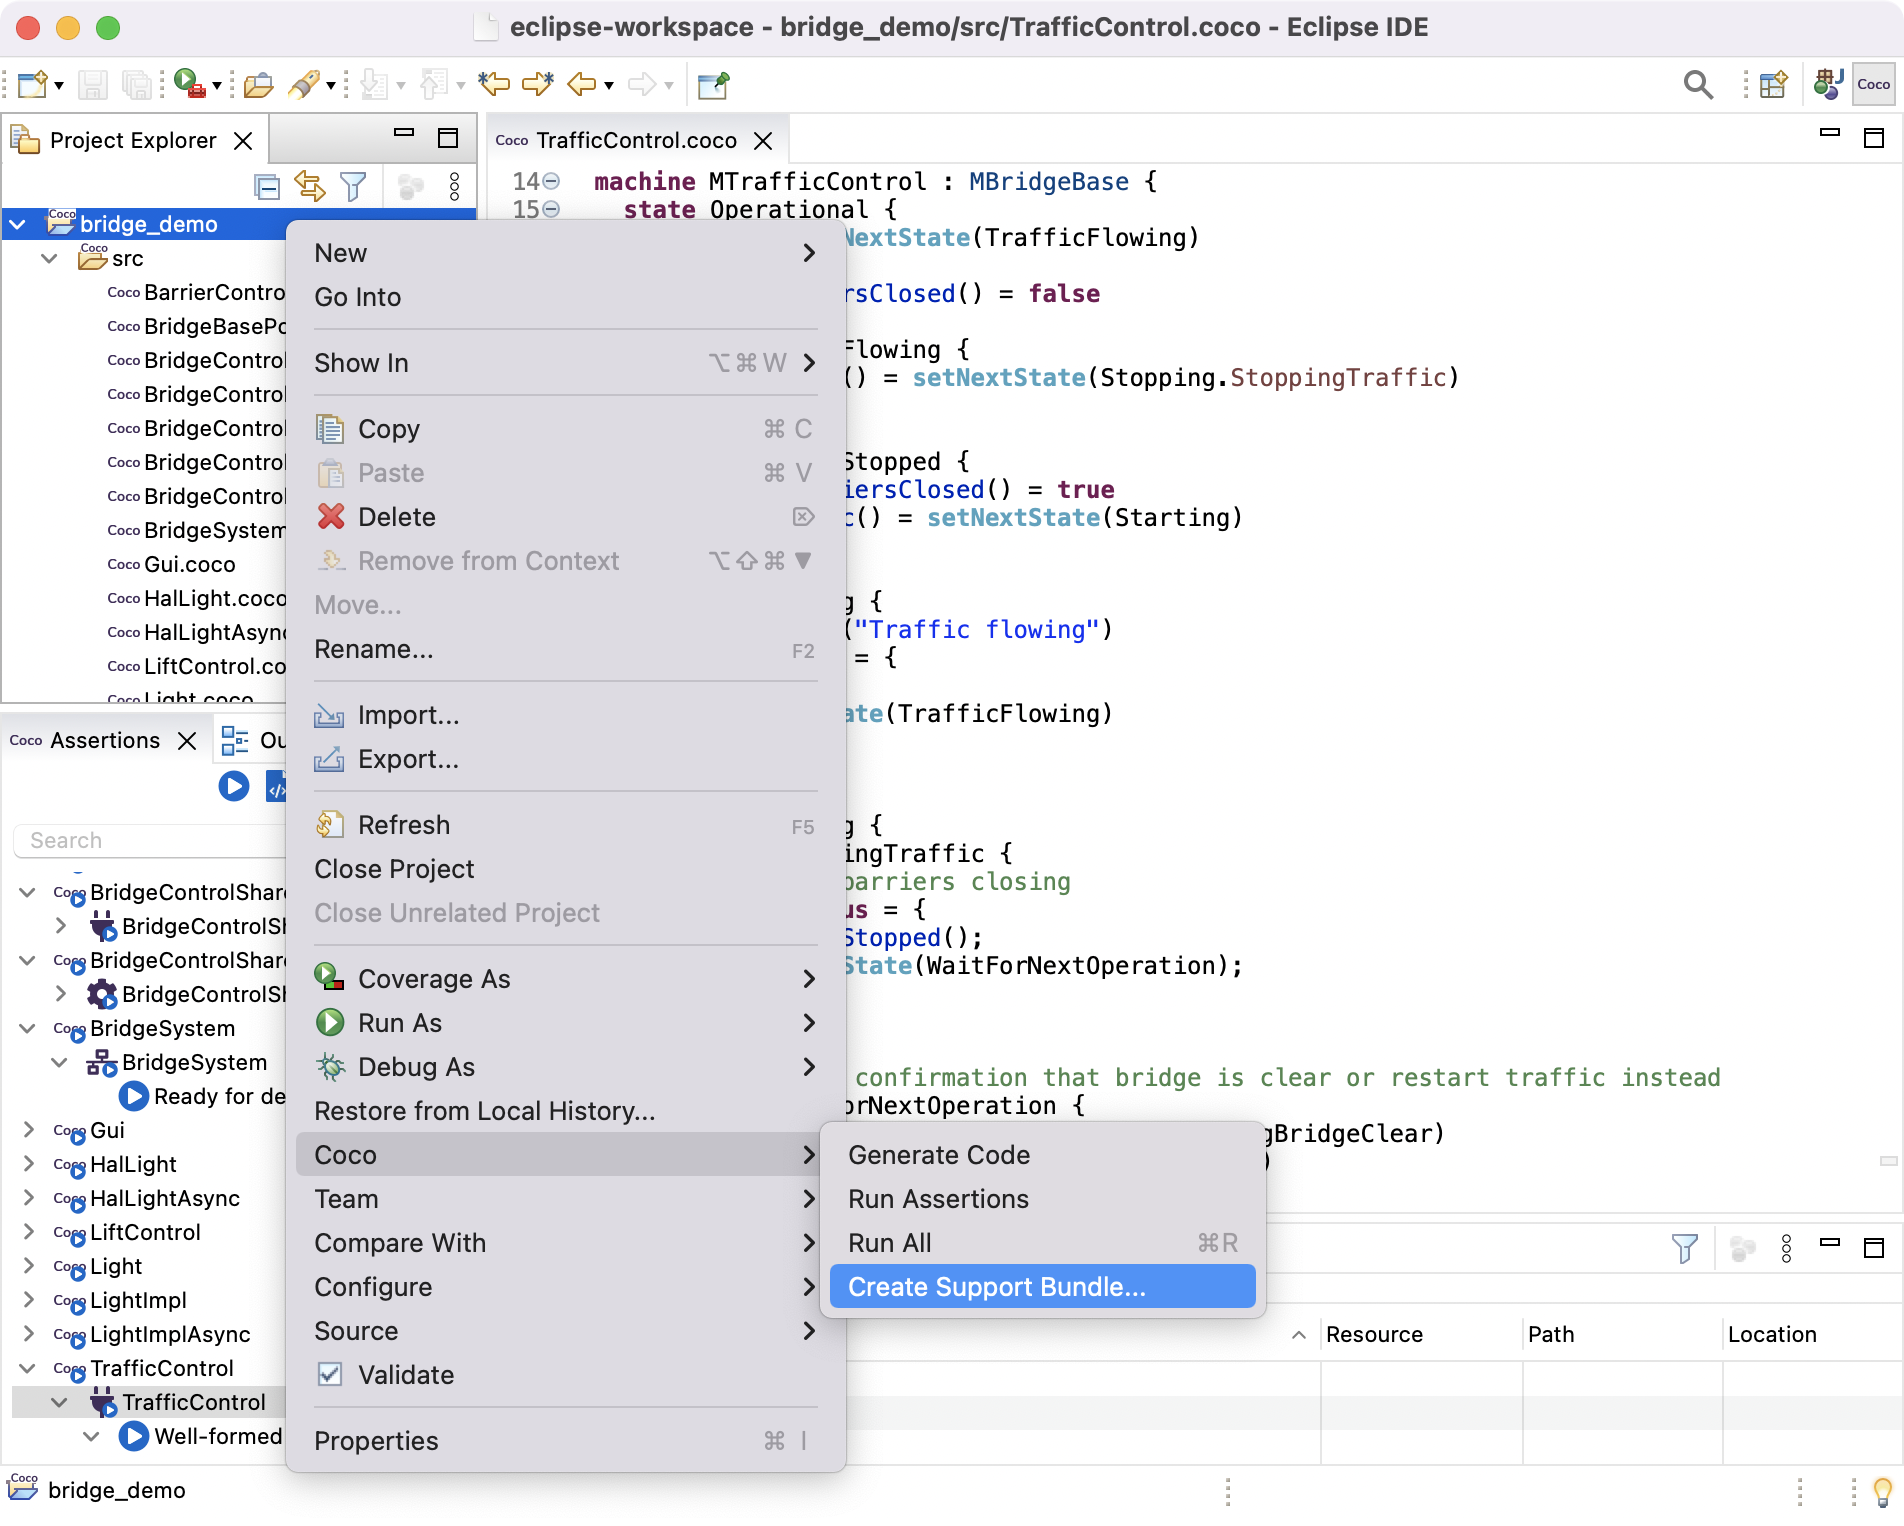
To create a support bundle directly in Eclipse, right-click on a project in the Project Explorer view, and select Popili → Create Support Bundle… from the popup menu:
The following popup will appear, where you can choose to export the ZIP file, or include it as an attachment in an email:
Getting Updates
To check for, and install, updates of Popili, select Help → Check for Updates.
You can customise how Eclipse reacts to new versions being available by selecting Eclipse → Preferences → Install/Update.
Uninstalling Popili
To uninstall Popili:
- Select Eclipse → About Eclipse, and click Installation Details in the popup window.
- Enter the word popili in the type filter text box, select all of the Popili-related entries, click Uninstall, and then click Finish.
- Click Restart Now in the dialogue window to restart Eclipse.
- Select Eclipse → Preferences, expand General to view its sublist of options, and click on Perspectives.
- Select all entries with popili in the name. This can appear in the list as
<popili>or<<popili>>. Click Delete to remove the Popili perspectives.
Popili is now uninstalled.